
SlideServe
Menu
Préférences
© SlideServe · v2026

Diabetes Mellitus Impact on Biomarker Correlations in Osteoarthritis

sasson avatar
1 diapositives · 88 Views · Oct 03, 2014

Study on correlations between biomarkers and collagen crosslinks in osteoarthritis patients with and without diabetes mellitus, revealing complexities in the disease process.
Diabetes Mellitus Impact on Biomarker Correlations in Osteoarthritis - slide 1
01 / 1Diabetes Mellitus Impact on Biomarker Correlations in Osteoarthritis
1 / 17

Télécharger la présentation

Diabetes Mellitus Impact on Biomarker Correlations in Osteoarthritis
Une image / un lien ci-dessous est fourni (tel quel) pour télécharger la présentation

Politique de téléchargement : le contenu du site vous est fourni TEL QUEL pour votre information et votre usage personnel ; il ne peut être vendu, concédé sous licence ni partagé sur d’autres sites sans l’accord de son auteur.Le contenu vous est fourni TEL QUEL, pour votre information et votre usage personnel uniquement. Téléchargez la présentation en cliquant sur ce lien. Lors du téléchargement, si vous ne parvenez pas à télécharger une présentation, l’éditeur a peut-être supprimé le fichier de son serveur.Pendant le téléchargement, si vous ne parvenez pas à obtenir une présentation, le fichier a peut-être été supprimé par l’éditeur.

F I N

Plus de contenu associé

Transcription de la présentation
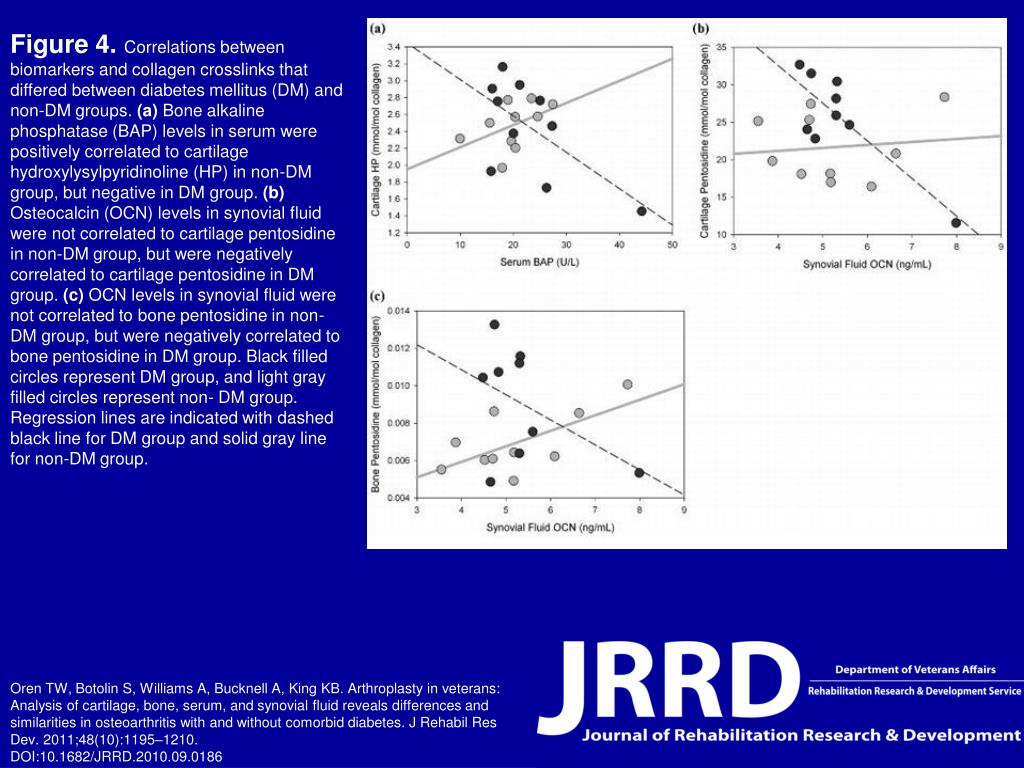
  1. Figure 4. Correlations between biomarkers and collagen crosslinks that differed between diabetes mellitus (DM) and non-DM groups. (a) Bone alkaline phosphatase (BAP) levels in serum were positively correlated to cartilage hydroxylysylpyridinoline (HP) in non-DM group, but negative in DM group. (b) Osteocalcin (OCN) levels in synovial fluid were not correlated to cartilage pentosidine in non-DM group, but were negatively correlated to cartilage pentosidine in DM group. (c) OCN levels in synovial fluid were not correlated to bone pentosidine in non-DM group, but were negatively correlated to bone pentosidine in DM group. Black filled circles represent DM group, and light gray filled circles represent non- DM group. Regression lines are indicated with dashed black line for DM group and solid gray line for non-DM group. Oren TW, Botolin S, Williams A, Bucknell A, King KB. Arthroplasty in veterans: Analysis of cartilage, bone, serum, and synovial fluid reveals differences and similarities in osteoarthritis with and without comorbid diabetes. J Rehabil Res Dev. 2011;48(10):1195–1210.DOI:10.1682/JRRD.2010.09.0186