Air Quality Modeling in China and Taiwan Using CMAQ: A Comprehensive Assessment
390 likes | 502 Vues
This study presents a detailed assessment of air quality modeling over China and Taiwan using the Models-3/CMAQ system. The analysis covers the modeling domains for Great China with various grid resolutions (36-/12-/4-km) and focuses on episodes from July and January 2001. Key features include multi-pollutant simulations based on TRACE-P emission inventories. The results highlight ozone layer distributions, NOx and SO2 emission assessments, and regional modeling intricacies for Beijing. This workshop presentation is essential for understanding air quality management and environmental policy formulation.

Air Quality Modeling in China and Taiwan Using CMAQ: A Comprehensive Assessment
E N D
Presentation Transcript
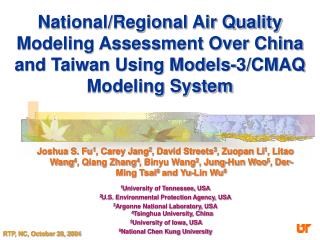
National/Regional Air Quality Modeling Assessment Over China and Taiwan Using Models-3/CMAQ Modeling System Joshua S. Fu1, Carey Jang2, David Streets3, Zuopan Li1, Litao Wang4, Qiang Zhang4, Binyu Wang2, Jung-Hun Woo5, Der-Ming Tsai6 and Yu-Lin Wu6 1University of Tennessee, USA 2U.S. Environmental Protection Agency, USA 3Argonne National Laboratory, USA4Tsinghua University, China 5University of Iowa, USA 6National Chen Kung University RTP, NC, October 20, 2004
------------------------------------------------------------------------------------- Models-3/CMAQ Workshop, RTP, NC, October 20, 2004 Models-3/CMAQ Study Domains Domain : Great China Region Grid Resolution : 36-/12-/4-km (Nested Modeling) Episode : July 1-20, 2001 January 1-20 , 2001
------------------------------------------------------------------------------------- Models-3/CMAQ Workshop, RTP, NC, October 20, 2004 China National/Regional Modeling Configuration • Features : Models-3/CMAQ One-Atmosphere (multi-pollutants) Run • July and January 2001 CMAQ Runs • Nationwide, East China/Beijing CMAQ Domains • Model Setup : • NASA’s TRACE-P emission inventories and Beijing local emissions and GEIA biogenic emission inventory • Emissions Processing: Spatial allocation (GIS/Gridding), Temporal, speciation needed for the M3/CMAQ simulations • 36-km (164x97), 12-km (175x211), and 4-km (160x142), (90x90), (97x133), 14 vertical layers • Meteorology : MM5 V3.6.2 • CMAQ (February, 2004 version)
------------------------------------------------------------------------------------- Models-3/CMAQ Workshop, RTP, NC, October 20, 2004 China National/Regional Application Ozone • Layer distribution : • Layer 1: 38 m • Layer 2: 91.5 m • Layer 3: 152.9 m • Layer 4: 230.3 m • Layer 5: 339.5 m • Layer 6: 481.6 m • Layer 7: 845.8 m • Layer 8:1300.7 m • : • : • Layer 14: 16262.4 m
------------------------------------------------------------------------------------- Models-3/CMAQ Workshop, RTP, NC, October 20, 2004 Convert TRACE-P emission data to CB IV Speciations
------------------------------------------------------------------------------------ Models-3/CMAQ Workshop, RTP, NC, October 20, 2004 China Regional Modeling (Nesting): O3 36-km 12-km 4-km
------------------------------------------------------------------------------------- Models-3/CMAQ Workshop, RTP, NC, October 20, 2004 NOx Emissions (36kmx36km) TRACE-P January EM TRACE-P July EM
------------------------------------------------------------------------------------- Models-3/CMAQ Workshop, RTP, NC, October 20, 2004 NOx Emissions (12kmx12km) TRACE-P January EM TRACE-P July EM
------------------------------------------------------------------------------------- Models-3/CMAQ Workshop, RTP, NC, October 20, 2004
------------------------------------------------------------------------------------- Models-3/CMAQ Workshop, RTP, NC, October 20, 2004 NOx Emissions (4kmx4km) TRACE-P January EM TRACE-P July EM
------------------------------------------------------------------------------------- Models-3/CMAQ Workshop, RTP, NC, October 20, 2004 NOx Emissions (4kmx4km) Beijing EMISSION TRACE-P EMISSION
------------------------------------------------------------------------------------- Models-3/CMAQ Workshop, RTP, NC, October 20, 2004 SO2 Emissions (4kmx4km) Beijing EMISSION TRACE-P EMISSION
------------------------------------------------------------------------------------- Models-3/CMAQ Workshop, RTP, NC, October 20, 2004 PAR Emissions Beijing EMISSION TRACE-P EMISSION
------------------------------------------------------------------------------------- Models-3/CMAQ Workshop, RTP, NC, October 20, 2004 Difference of PAR Emissions Beijing EMISSION – TRACE-P EMISSION
------------------------------------------------------------------------------------- Models-3/CMAQ Workshop, RTP, NC, October 20, 2004 Wind Field
------------------------------------------------------------------------------------- Models-3/CMAQ Workshop, RTP, NC, October 20, 2004 China Regional Modeling (Nesting): O3 36-km 12-km 4-km (2PM July 15 , 2001.)
------------------------------------------------------------------------------------- Models-3/CMAQ Workshop, RTP, NC, October 20, 2004 Air Quality Modeling Assessment in Beijing (base case- July 2001) Ozone TRACE-P EMs Beijing EMs
------------------------------------------------------------------------------------- Models-3/CMAQ Workshop, RTP, NC, October 20, 2004 Beijing Regional (4-km) Modeling: O3 TRACE-P EMs Beijing EMs (July 4-20, 2001, episode max.)
------------------------------------------------------------------------------------- Models-3/CMAQ Workshop, RTP, NC, October 20, 2004 Sensitivity runs for Beijing region (base case- July 2001) Ozone Beijing EMs 2xVOC Beijing EMs 3xVOC Beijing EMs
------------------------------------------------------------------------------------- Models-3/CMAQ Workshop, RTP, NC, October 20, 2004 Sensitivity runs for Beijing region (base case- July 2001) Ozone Beijing EMs 2xVOC Beijing EMs 3xVOC Beijing EMs (July 4-20, 2001, episode max.)
Episodic Max O3 (2001 July ) Transported No transported Zero out
------------------------------------------------------------------------------------- Models-3/CMAQ Workshop, RTP, NC, October 20, 2004 O3 Daily Max (2001 July )
------------------------------------------------------------------------------------- Models-3/CMAQ Workshop, RTP, NC, October 20, 2004 Beijing Regional (4-km) Modeling: PM 2.5 January July 75 ug/m3 150 ug/m3 (Jan./July 4-20, 2001, episode avg.)
------------------------------------------------------------------------------------- Models-3/CMAQ Workshop, RTP, NC, October 20, 2004 PM2.5 Composition in Beijing (Jan.) M3/CMAQ (4-km) January 4-20, 2001 PM2.5: 154(ug/m3 ) PM2.5 Composition in Beijing (July) M3/CMAQ (4-km) July 4-20, 2001 PM2.5: 99(ug/m3 )
------------------------------------------------------------------------------------- Models-3/CMAQ Workshop, RTP, NC, October 20, 2004 Episodic AVG PM2.5 (2001 July ) Nested BC Background BC Zero out
------------------------------------------------------------------------------------- Models-3/CMAQ Workshop, RTP, NC, October 20, 2004 cn4B0 PM 2.5 Daily MAX Animation (2001 July )
------------------------------------------------------------------------------------- Models-3/CMAQ Workshop, RTP, NC, October 20, 2004 CMAQ vs. Obs. PM 2.5 Episode Average 154 140 99 88
------------------------------------------------------------------------------------- Models-3/CMAQ Workshop, RTP, NC, October 20, 2004 Models-3/CMAQ Pilot Study Domains Domain : Greater China Region Grid Resolution : 36-km/12-km/4km (Nested Modeling) Episodes : Jan. (Jan., April, Oct.) , 2001
------------------------------------------------------------------------------------- Models-3/CMAQ Workshop, RTP, NC, October 20, 2004 Taiwan Regional Air Quality ModelingPreliminary Results for January Case • Features : • Models-3/CMAQ One-Atmosphere (multi-pollutants) Run • Model Setup : • NASA’s TRACE-P emission inventories and GEIA biogenic emission inventory and TEDS • Emissions Processing: Spatial allocation (GIS/Gridding), Temporal, speciation and SMOKE needed for the M3/CMAQ simulations • Domains: 36-km (130X94),12-km (135X198) and 4-km (56X108), 12 vertical layers • Meteorology : MM5 (V3.5) considered snow cover, NCEP data for IC and BC • CMAQ 4.3
------------------------------------------------------------------------------------- Models-3/CMAQ Workshop, RTP, NC, October 20, 2004 Air Quality Modeling over China & Taiwan :Model Nesting 12-km 4-km 36-km
------------------------------------------------------------------------------------- Models-3/CMAQ Workshop, RTP, NC, October 20, 2004 Wind Field
------------------------------------------------------------------------------------- Models-3/CMAQ Workshop, RTP, NC, October 20, 2004 The Effects of Air Pollutants Transport in Taiwan Ozone Background air BC Nested air BC Diff
------------------------------------------------------------------------------------- Models-3/CMAQ Workshop, RTP, NC, October 20, 2004 Nested Modeling at Different Grid Resolution: PM 2.5 4-km (non-nested) 12-km 36-km Taiwan (Jan. 4-20, 2001, episode avg.)
------------------------------------------------------------------------------------- Models-3/CMAQ Workshop, RTP, NC, October 20, 2004 The Effects of Air Pollutants Transport in Taiwan PM2.5 Background air BC Nested air BC Diff
------------------------------------------------------------------------------------- Models-3/CMAQ Workshop, RTP, NC, October 20, 2004 The Effects of Air Pollutants Transport in Taiwan Visibility (Deciview) Background air BC Nested air BC Diff
------------------------------------------------------------------------------------- Models-3/CMAQ Workshop, RTP, NC, October 20, 2004 Summary • The first ever application using “One Atmosphere” CMAQ modeling system for Beijing regional air quality modeling • Emissions: Investigate Trace-P Asian emissions and apply Beijing local emissions and Taiwan emission inventory, especially NOx, SO2 and VOC emissions, e.g., ALD2, OLE, PAR. • The use of monitoring data is essential to against CMAQ modeling results • CMAQ model performance is acceptable for PM25 but ozone concentrations are under predicted • VOC found that it may be underestimated in China from sensitivity runs
------------------------------------------------------------------------------------- Models-3/CMAQ Workshop, RTP, NC, October 20, 2004 Summary • Models-3/CMAQ has been tested for January and July scenarios in national/regional/urban scales in China and Taiwan • 36-km, 12-km and 4-km. • Select typical episodes in January, and October-November (O3), 2001 to further study for the China and Taiwan 4-km domains.
------------------------------------------------------------------------------------- Models-3/CMAQ Workshop, RTP, NC, October 20, 2004 Acknowledgment • USEPA and Taiwan EPA funding support • University of Tennessee Office of Research • Argonne National Laboratory • Tsinghua University • University of Iowa • National Cheng Kung University