Download
1 / 16
160 likes | 184 Vues
Explore natural selection in rabbit populations through genetic trait analysis. Understand gene frequency changes over generations in this educational breeding lab. Learn about the impact of fur traits on rabbit survivability.

E N D
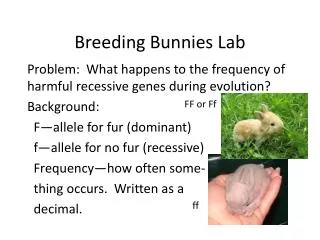
Breeding Bunnies Lab Intro:In this activity, you will examine natural selection in a small population of wild rabbits. Evolution, on a genetic level, is a change in the frequency of alleles in a population over a period of time. Breeders of rabbits have long been familiar with a variety of genetic traits that affect the survivability of rabbits in the wild, as well as in breeding populations.
One such trait is the trait for furless rabbits (naked bunnies). This trait was first discovered in England by W.E. Castle in 1933. The furless rabbit is rarely found in the wild because the cold English winters are a definite selective force against it.
Note: In this lab, the dominant allele for normal fur is represented by F and the recessive allele for no fur is represented by f. Bunnies that inherit two F alleles or one F and one f allele have fur, while bunnies that inherit two fs have no fur.
Procedures: 1. Use the gene frequency data and discussion questions and write a hypothesis and specific predictions based on your hypothesis. 2. You will be working in assigned groups. Everyone should take turns doing each part of the lab. Gather all materials Breeding Bunnies: Gene Frequency Data , Breeding Bunnies: Discussion Questions, 50 red beans, 50 white beans, 1 paper bag, 2 cups, 1 petri dish, and pens. 3. The red beans represent the allele for fur, and the white beans represent the allele for no fur. The bag represents the English countryside, where the rabbits randomly mate.
Breeding Bunnies: Gene Frequency Data How does natural selection affect gene frequency over several generations? 1. Clearly state your hypothesis (a tentative explanation or solution to the problem). __________________________________________________________________________________________ __________________________________________________________________________________________ State what you would predict (if your hypothesis is true) about the frequency of F alleles and f alleles in the population of rabbits after 10 generations, where ff bunnies are selected against (do not survive). __________________________________________________________________________________________
4. Label one dish FF for the homozygous dominant genotype. Label a second dish Ff for the heterozygous condition. Label the third dish ff for those rabbits with the homozygous recessive genotype. 5. Place the 50 red and 50 white beans (alleles) in the container and shake up (mate) the rabbits. (Please note that these frequencies have been chosen arbitrarily for this activity.) 6. Without looking at the beans, select two at a time, and record the results on the data form next to "Generation 1." For instance, if you draw one red and one white bean, place a mark in the chart under "Number of Ff individuals." Continue drawing pairs of beans and recording the results in your chart until all beans have been selected and sorted. Place the "rabbits" into the appropriate dish: FF,Ff, or ff. (Please note that the total number of individuals will be half the total number of beans because each rabbit requires two alleles.)
7. The ff bunnies are born furless. The cold weather kills them before they reach reproductive age, so they can't pass on their genes. Place the beans from the ff container aside (petri dish) before beginning the next round. 8. Count the F and f alleles (beans) that were placed in each of the "furred rabbit" dishes in the first round and record the number in the chart in the columns labeled "Number of F Alleles" and "Number of f Alleles." (This time you are really counting each bean, but don't count the alleles of the ff bunnies because they are dead.) Total the number of F alleles and f alleles for the first generation and record this number in the column labeled "Total Number of Alleles." 9. Place the alleles of the surviving rabbits (which have grown, survived and reached reproductive age) back into the container and mate them again to get the next generation.
10. Repeat steps five through nine to obtain generations two through ten. If working as a team, make sure everyone in your group has a chance to either select the beans or record the results. 11. Determine the gene frequency of F and f for each generation and record them in the chart in the columns labeled "Gene Frequency F" and "Gene Frequency f." To find the gene frequency of F, divide the number of F by the total, and to find the gene frequency of f, divide the number of f by the total. Express results in decimal form. The sum of the frequency of F and f should equal one for each generation. 12. Graph your frequencies. Prepare a graph with the horizontal axis as the generation and the vertical axis as the frequency in decimals. Plot all frequencies on one graph. First, plot your own data. Use a solid line (or colored pencil) for F and a dashed line (or different color) for f. 14. Complete the Discussion Questions form with your group. 15. We will discuss all groups’ data when all are done.
2. State your original hypothesis. Based on your lab data, do you accept or reject the original hypothesis? Explain. 3. Compare the number of alleles for the dominant characteristic with the number of alleles for the recessive characteristic. 4. Compare the frequencies of the dominant allele to the frequencies of the recessive allele. 5. In a real rabbit habitat new animals often come into the habitat (immigrate), and others leave the area (emigrate). How might emigration and immigration affect the gene frequency of F and f in this population of rabbits? How might you simulate this effect if you were to repeat this activity? 6. How do your results compare with the class data? If significantly different, why are they different? 7. How are the results of this simulation an example of evolution?
Bunny lab 1. Testable If… then… hypothesis stated? 2. controlled experiment? 3. Does it test the hypothesis? 4. Data collected 5. Data analyzed/ graphed/explained 6. Is there a clear claim statement? 7. Does the data support the claim? 8. Is there a clear statement of the justification for the data supporting the claim? ( is your reasoning explained using scientific terms, laws or theories)
Your assignment: • To conclude this experience, each of you will write on your own paper an answer to the question: How did the Bunny lab demonstrate natural selection which resulted in evolution of this population? Do your results support or reject Hardy-Weinberg Equilibrium? Explain why or why not. Make sure to include actual data and/or equations to support your answers! • The final lab is due Thursday. Be NEAT and THOROUGH!
Beans/food gathering adaptations This time,you get to design the lab! Given the materials, decide on a testable question about the beans or the organism hunting the beans. This should demonstrate natural selection, gene flow or genetic drift. If you need more materials ask! You must complete the experimental design plan given to your group and get approval before you begin.
Self check/ evaluation rubric 1. Testable If… then… hypothesis stated? 2. controlled experiment? 3. Does it test the hypothesis? 4. Data collected 5. Data analyzed/ graphed/explained 6. Is there a clear claim statement? 7. Does the data support the claim? 8. Is there a clear statement of the justification for the data supporting the claim? ( is your reasoning explained using scientific terms, laws or theories)
Your Lab Report Should Have: Claim: a statement Evidence: data charts, explained to support your claim… make your case! The data is what people believe! Justification: Why this makes sense! Your reasoning!