Download

1 / 49
490 likes | 520 Vues
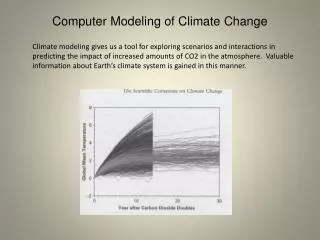
Explore the science and technology behind climate modeling, predicting future changes, and understanding the impact of human activities on global warming. Learn about computational demands, advancements in modeling tools, and the complexities of addressing climate variability. Dive into the factors influencing climate change and the importance of high-resolution data simulations for accurate predictions. Discover the significance of atmospheric and oceanic models in assessing climate dynamics and explore the latest research on greenhouse gas impacts and temperature projections.

E N D
Modeling and Predicting Climate Change Michael Wehner Scientific Computing Group Computational Research Division mfwehner@lbl.gov
“Climate is what you expect… • …weather is what you get!” Ed Lorenz
Global Warming: Do you believe? • Intergovernmental Panel on Climate Change 2001 • “An increasing body of observations gives a collective picture of a warming world and other changes in the climate system” • “There is new and stronger evidence that most of the warming observed over the last 50 years is attributable to human activities”
The data • Fact: Global mean surface air temperature is increasing. • Is this warming due to human factors? • Can we quantify natural variability? Signal to noise. • Do we understand the causes of this warming? • What does the future portend? • What will happen where I live? • Modeling helps us address these questions.
Projections of future climate change • Surface air temperature projections over the US • Projections, not predictions.
SUMMER Surface air temp. (JJA)A2 16-model avg A2 3-model avg A1fi 3-model avg
Palmer Drought Severity Index • End of 21st Century (A1B) relative to 1950-1999 average
Computational demands • Historically, climate models have been limited by computer speed. • 1990 AMIP1: Many modeling groups required a calendar year to complete a 10 year integration of a stand alone atmospheric general circulation model. Typical grid resolution was T21 (64X32x10) • 2011 CCSM5: A fully coupled atmosphere-ocean-sea ice model achieves ~15 simulated years per actual day. • Typical global change simulation is 1 or 2 centuries. • Control simulations are 10 centuries. • Atmosphere is 1o (365x180x26) • Ocean is ~1o (384X320x40)
Current resolution is not enough • Atmosphere • Regional climate change prediction will require horizontal grid resolution of 10km (3600X1800) • Cloud physics parameterizations could exploit 100 vertical layers • Explicitly resolving cloud systems requires 1km. Estimated 28Pflops sustained. • Ocean • Mesoscale (~50km) eddies are thought to be crucial to ocean heat transport • 0.1o grid will resolve these eddies (3600X1800) • Short stand-alone integrations are underway now. • Ensembles of integrations are required to address issues of internal (chaotic) variability. • Current practice is to make 4 realizations. 10 is better.
Simulated precipitation as a function of resolution Duffy, et al 300km 75 km 50 km
Model resolution and extreme precipitation • 20 year return value of annual maximum daily total precipitation (mm/day)
Movie • Go to CAM5 simulation • See http://vis.lbl.gov/~prabhat/CCSM/Movies/Horst/
Global average / year • total TC • observations 87±8 • cam5.1 84±9 • total hurricanes • Observations 49±7 • cam5.1 52 • cat1 21 • cat2 5 • cat3 12 • cat4 7 • cat5 1.5
High resolution is expensive • This calculation used only 7680 processors on a 120,000 processor machine • 5.5 million processor hours. • 25 km grid cell • The coming models will be able to use ~100K processors • US DOE has a 750K processor machine on order. • Machines in excess of 10M processors are 5-10 years out • Co-design of hardware & software • Search “green flash berkeley”
Large datasets • The output present analysis challenges • 30 year simulation produced 100TB of output • Hurricane tracking would take over 1 year on a workstation • 2 hours on 3650 processors per decade • High frequency analysis must be done on parallel machines
What is in a climate model? • Atmospheric general circulation model • Dynamics • Sub-grid scale parameterized physics processes • Turbulence, solar/infrared radiation transport, clouds. • Oceanic general circulation model • Dynamics (mostly) • Sea ice model • Viscous elastic plastic dynamics • Thermodynamics • Land Model • Energy and moisture budgets • Biology • Chemistry • Tracer advection, possibly stiff rate equations.
Technology limits us. • Models of atmospheric and ocean dynamics are subject to time step stability restrictions determined by the horizontal grid resolution. • Adds further computational demands as resolution increases • Century scale integrations at 1km will require of order 28Pflops (sustained). • Current production speed is of order tens to hundreds of Gflops in the US.
Q.Why are climate models so computationally intensive? • A. Lots of stuff to calculate! • This is why successful climate modeling efforts are collaborations among a diverse set of scientists. • Big science. • But this computational burden has other causes. • Fundamental cause is that interesting climate change simulations are century scale. Time steps are limited by stability criterion to minute scale. • A lot of minutes in a century.
An example of a source of computational burden • Task: Simulate the dynamics of the atmosphere • The earth is a sphere (well, almost). • Discretize the planet. • Apply the equations of motion • Two dimensional Navier-Stokes equations + parameterization to represent subgrid scale phenomena
Spherical Coordinates (q,f) • Latitude-Longitude grid. • Uniform in q,f • Non-uniform cell size. • Convergent near the poles • Singular • Simple discretization of the equations of motion. • Finite difference. • Finite volume.
Spherical Coordinates (q,f) • Two issues. • Courant stability criterion on time step • Dt < Dx/v • Dx = grid spacing, v = maximum wind speed • Convergence of meridians causes the time step to be overly restrictive. • Accurate simulation of fluids through a singular point is difficult. • Cross-polar flows will have an imprint of the mesh.
Spherical Coordinates (q,f) • Solutions to time step restrictions. • Recognize that the high resolution in the polar regions is false. • Violate the polar Courant condition and damp out computational instabilities by filters. • Works great, but… • Maps poorly onto distributed memory parallel computers due to non-local communication. F` = SaijFi • Commonly used, most notably by UK Met Office (Exeter) and the Geophysical Fluid Dynamics Laboratory (Princeton)
Spectral Transform Method • The most common solution to the “polar problem” • Map the equations of motions onto spherical harmonics. • M = highest Fourier wavenumber • N(m) = highest associated Legendre polynomial, P • Resolution is expressed by the truncation of the two series. I.e. • T42 means triangular truncation with 42 wavenumbers • R15 means rhomboidal truncation with 15 wavenumbers.
Spectral Transform Method • Replace difference equations with Fourier and Legendre transforms. • Advantages • No singular points. • Uniform time step stability criteria in spectral space. • Very accurate for two-dimensional flow • Fast Fourier Transforms (FFT) • scales as mlog(m) rather than m2 • Very fast if m is a power of 2 • Very fast vector routines supplied by vendors.
Spectral Transform Method • Disadvantages • No parallel FFT algorithms for m in the range of interest. • mlog(m) is still superlinear. Scaling with higher resolution is poor. • Works poorly near regions of steep topography like the Andes or Greenland. • Gibb’s phenomena causes ‘spectral rain’ and other nonphysical phenomena
Spectral Transform Method • Use of FFT limits parallel implementation strategies • CCSM3 uses a one dimensional domain decomposition. • Restricts number of useful processors. • ECMWF uses three separate decompositions. • One each for Fourier transforms, Legendre transforms and local physics. • Requires frequent global redecompositions of every prognostic variable. • No further communication required within each step. • Hence, code is simpler as communications are isolated. • Operational CCSM3 resolution is T85 • LLNL collaborators have run up to T389 • ECMWF performs operational weather prediction at T1000+
Alternative formulations • An icosahedral mesh approximation to a sphere n=1 n=2 n=4 • No polar singularities • But 6 points in each hemisphere have a different connectivity
Icosahedral mesh • Spatially uniform • Ideal for finite differences • Would also be ideal for advanced finite volume schemes. • Easily decomposed into two dimensional subdomains for parallel computers. • Connectivity is complicated. Not logically rectangular. • Used in the Colorado State University climate model and by Deutsche Wetterdienst, a weather prediction service. • Japanese group plans to run at 400mglobally on their next machine!!!!
Cubed Sohere • Similar to the icosahedral grid • 8 special connectivity points instead of 10 • Grid is logically rectangular • Not as spatially uniform
A final creative mesh • In ocean circulation modeling, the continental land masses must be accounted for. • If the poles were covered by land, no active singular points in a rectangular mesh. • A clever orthogonal transformation of spherical coordinates can put the North Pole over Canada or Siberia. • Careful construction of the transformation can result in a remarkably uniform mesh. • Used today in the Los Alamos ocean model, POP.
A general modeling lesson from this example. • Modeling is always a set of compromises. • It is not exact. Remember this when interpreting results! • Many different factors must be taken into account in the construction of a model. • Fundamental equations are dictated by the physics of the problem. • Algorithms should be developed with consideration of several factors. • Scale of interest. High resolution, long time scales, etc. • Accuracy • Available machine cycles. • Cache • Vectors • Communications • Processor configuration (# of PEs, # of nodes, etc.)
Computational Science Opportunities • Petaflop computing • Millions of processors • multi-core chips • Higher efficiencies • 5% of peak performance is considered good • Hardware/software co-design • Large databases • Petabytes to exabytes • Database management • Efficient distribution to analysts • Parallel diagnostic routines
Conclusions • Climate change prediction is a “Grand Challenge” modeling problem. • Large scale multidisciplinary research requiring a mix of physical and computational scientists. • The path for the modeling future is relatively clear. • Higher resolution Regional climate change prediction • Larger ensembles, longer control runs, more parameter studies quantify uncertainty in predictions • More sophisticated physical parameterizations better simulation of the real system • All of this requires substantial increases in US investments in hardware and software.
Editorial comment • My generation has only identified that there is a problem. • The general public seems to finally accept that. (Or at least they did for a while.) • We leave it to your generation to do something about it. • And computer simulation will continue to play a major role!
Additional climate model resources • Intergovernmental Panel on Climate Change • http://www.ipcc.ch/ • Community Climate System Model • http://www.cgd.ucar.edu/csm • IPCC model data distribution • http://www-pcmdi.llnl.gov • Climate data tools (PYTHON) • http://esg.llnl.gov/cdat • SciDAC Earth System Grid project • CCSM and PCM data distribution • http://www.earthsystemgrid.org • Michael Wehner, mfwehner@lbl.gov