RESEARCH METHODS IN I/O PSYCHOLOGY
870 likes | 1.79k Vues
RESEARCH METHODS IN I/O PSYCHOLOGY. Goals of Science. Description Prediction Explanation. Research process - summarized as 5–step sequence. Statement of the problem. Design of research study. Measurement of variables. Analysis of data. Conclusions from research.

RESEARCH METHODS IN I/O PSYCHOLOGY
E N D
Presentation Transcript
Goals of Science • Description • Prediction • Explanation
Research process - summarized as 5–step sequence Statement of the problem Design of research study Measurement of variables Analysis of data Conclusions from research The Empirical Research Cycle
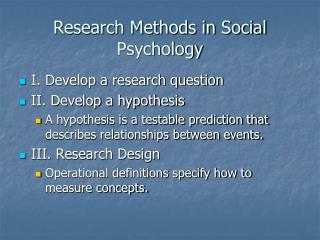
Statement of the problem Design of research study Measurement of variables Analysis of data Conclusions from research STATEMENT OF THE PROBLEM Theory - Inductive method - Deductive method
STATEMENT OF THE PROBLEM Statement of the problem Hypothesis Statement: It is difficult for individuals in dual-career families to experience WF balance. Research Question: How can individuals in dual-career families experience WF balance? Hypothesis: Dual-career individuals who have family and organizational support are more likely to experience WF balance compared to dual-career individuals with no family and organizational support. Example:
Statement of the problem Design of research study Measurement of variables Analysis of data Conclusions from research RESEARCH DESIGN • Plan of Study • Internal & External Validity • Naturalness of Setting • Degree of Control • Primary Research Methods • Laboratory Experiment • Quasi Experiment • Questionnaire • Observation • Qualitative • Secondary Research
Plan of Study: Internal Validity The extent to which we can infer that a relationship between two variables is causal or that absence of a relationship implies absence of cause. The extent to which observed relationship obtained from research design/study is real or artifactual.
Plan of Study: External Validity The extent to which the findings from a research study are relevant to individuals and settings beyond those specifically examined in the study. The extent to which observed relationship obtained from research design/study are “generalizable”.
Plan of Study: Naturalness of Research Setting Field Lab or • - "artificiality" • contrived and artificial • controlled • "naturalness" • typically employs a real–life setting
Plan of Study:Degree of Control • Confounding and extraneous variables • Manipulation—this is reflective of a high degree of control • Research designs that permit manipulation are technically referred to as "experiments"
Primary Research There are 5 categories of types of Primary Research: Laboratory (experimental) Quasi-experimental Questionnaire Observation Qualitative
Primary Research:Experimental Research • Experiment • Investigator manipulates a variable under carefully controlled conditions and observes whether changes occur in a second variable • Used to detect cause-and-effect relationships • Conditions that make a true experiment • Manipulation of independent variables • Random assignment into experimental conditions (experimental conditions & control)
Primary Research:Experimental and Control Groups • Experimental group • Subjects who receive some special treatment in regard to the independent variable • Control group • Subjects who do not receive the special treatment given to the experimental group LOGIC: If the 2 groups are identical except for the variation created by the manipulation of IV, then any differences between groups must be due to manipulation of the IV
Sample Control Experimental Measure DV Example of Experimental Design
Advantages and Disadvantages of Experimental Research + permit cause-and-effect conclusions - lab experiments tend to be artificial - cannot be used to explore some research questions
Primary ResearchField Experiments: Quasi-Experiments • Participants must be and are selected for different conditions from pre–existing groups • Levels of the IV are/may be selected from pre–existing values and not created through manipulation by the researcher • Unlike true experimental designs where participants are randomly assigned to experimental and control groups, with quasi–experimental designs they are NOT • Quasi–experiments DO NOT permit the researcher to control the assignment of participants to conditions or groups
Quasi-Experimental Example Greenberg: Employee Theft and Underpayment Inequity
Greenberg: Employee Theft and Underpayment Inequity Pay deduction Expressed inequity (Employment theft) • Theft is a mechanism for redressing states of inequity • Adequate explanations can lessen feelings of inequity • This is “dose-responsive”: magnitude of the expressed inequity, rate of theft
Plant 1 Plant 2 Plant 3 Control No cut in pay Condition 1 Inadequate explanation Condition 2 Adequate explanation DV Employee theft Greenberg: Employee Theft and Underpayment Inequity
Greenberg: Employee Theft and Underpayment Inequity • Randomly selected treatment for A and B, C as control • Assumed/proved homogeneity among subjects in different plants • Same characteristics among those who dropped out. • Treatment was received the same by all workers in a plant.
Primary Research: Naturalistic Observation • Careful, usually prolonged, observation of behavior without intervening directly with the subjects • No manipulation by researcher • No random assignment • Often referred to as ex post facto designs
Primary Research:Survey Research Measurement and assessment of opinions, attitudes, and other descriptive phenomenon usually by means of questionnaires and sampling methods • Popular method of research for I/O psychologists • Limitations include return rate • Web-based survey
Primary Research:Qualitative • A class of research methods in which the investigator takes an active role in interacting with the subjects he or she wishes to study • Interview/focus group • Ethnography: a research method that utilizes field observation to study a society’s culture. • Emic versus Etic • - Emic: an approach to researching phenomena that emphasizes knowledge derived from the participants’ understanding of their own culture. • - Etic: An approach to researching phenomena that emphasizes knowledge derived from the perspective of an objective investigator in understanding a culture.
Primary Research: Summary Issues: Obtaining access to samples Common method bias Choosing the correct design to answer the research question. Laboratory (experimental) Quasi-experimental Questionnaire Observation Qualitative
Secondary Research Methods A class of research methods that examines existing information from research • Meta-analysis – statistical procedure designed to combine the results of many individual, independently conducted empirical studies into a single result or outcome • Differences in studies could be due to statistical artifacts. • Issues: • - File draw effect • - Subjective nature of research
Statement of the problem Design of research study Measurement of variables Analysis of data Conclusions from research Measurement of Variables Types of Measurement Level of Measurement Characteristic
Measurement of Variables: Types of Variables Variable: Some property of an object, phenomenon, or event whose measurement can take on two or more values • Independent/dependent • Predictor/criterion • Continuous/discrete • Qualitative/quantitative
Measurement of Variables: Types of Variables What is the DV and what is the IV? In a study of the effects of different types of legal arguments on jurors’ perceptions of the guilt or innocence of a defendant, subjects were randomly assigned to hear an argument which related to their daily experiences or to an argument of a more abstract and idealistic nature. After listening to one of these legal arguments, subjects were asked to rate the guilt or innocence of the defendant on a twelve-point scale.
Measurement of Variables:Levels of Measurement A scale is a measuring device used to assess a person's score or status on a variable • The four basic types of scales are: • Nominal scales • Ordinal scales • Interval scales • Ratio scales
Measurement of Variables:Levels of Measurement Nominal Scale: 1=Single 2=Married 1 2 3 Ordinal Scale Not Satisfied Satisfied Very Satisfied 65 66 67 68 69 70 71 72 73 74 75 76 77 78 79 Interval Scale Degrees Fahrenheit 0 1 2 3 4 5 6 7 8 9 10 11 12 13 14 Ratio Scale Weight in pounds
Measurement of Variables:Characteristics of Good Measurement • Good test or measurement system should be: • - reliable • - valid • - objective • - standardized
Statement of the problem Design of research study Measurement of variables Analysis of data Conclusions from research STATISTICAL ANALYSES OF DATA Purpose Distributions and Their Shape Measures of Central Tendency Measures of Variability Correlation
Statistical Analysis:Purpose • Statistical tests are procedures that are used to: • - describe data • - analyze relationships between variables (i.e., make inferences)
Statistical Analysis: Distributions and Their Shape 68% 95% 99%
Statistical Analysis: Measures of Central Tendency - Mean - Median - Mode
Statistical Analysis: Measures of Central Tendency 12, 15, 10, 10, 9, 5, 10, 8, 12, 6, 7 12, 15, 10, 10, 9, 5, 10, 1, 8, 12, 6, 7
Statistical Analysis: Measures of Variability • Variability • Range • Standard Deviation
Statistical Analysis:The Concept of Correlation Permit investigators to see whether there is a link or association between the variables of interest. Does not permit cause-and-effect conclusions.
Statistical Analysis:The Concept of Correlation • A correlationexists when two variables are related to one another. • Two aspects of a correlation coefficient: • Direction: Positive or negative • Strength: Range of coefficients is from - 1.00 to +1.00
college GPA high school GPA Statistical Analysis:Positive Correlation
Statistical Analysis:Negative Correlation age hair on head
Job performance Cognitive ability Statistical Analysis:Positive Correlation
Statistical Analysis:Negative Correlation Role ambiguity Job satisfaction
Statistical Analysis (11 and 21)
Statistical Analysis (5’6” and 189lbs)
Statistical Analysis:Interpreting a Correlation • Correlation and prediction • Correlation and causation • X may cause Y • Y may cause X • Z causes both X and Y
Statistical Analysis:Summary ofCorrelation coefficients • The degree of linear relationship (association) between 2 variables • r • -1.0 to +1.0 • Correlation does not mean causality • Causality determined through laboratory or statistical control • Statistical vs. practical significance