Download
1 / 36
370 likes | 388 Vues
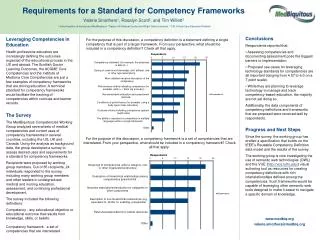
Learn the critical success points to leverage BI into oil and gas operations through GIS. Key steps: Vision, structure, nomenclature, workflows, and data intelligence. Focus on pipeline integrity, Maximo integration, and future system enhancements.

E N D
Leveraging BI into Oil & Gas Operations Through GIS Matt Thomas Sr. GIS Specialist, Spectra Energy Transmission
What are the Critical Success Points? Formulate a Plan • Commit to a vision, mission & strategy • Position organizational structure to support • Understand user needs Oversee Development • Standardize through Nomenclature • Create oversight committees & change control boards Be Prepared! • Use Nomenclature to prep data • Develop integration plans • Document workflows • Apply gap analysis where appropriate Apply ‘intelligence’ to the data • Carry key attribution elements • Utilize spatial query capabilities • Provide ad-hoc analysis capabilities to users
Building a Firm FoundationNomenclature/Taxonomy… Bring order out of chaos… Courtesy of NBC Before… …After
Building a Firm FoundationBusiness Process Improvement… 1. Define What’s the problem? Who can fix it? What’s the process? 6. Report Tell others Implement best practices 2. Measure Can I explain a problemwith data? BPI Model 5. Control Did we improve? Did we save money? 3. Analyze What’s the real problem? 4. Improve Let’s improve the process!
Understand the Users & Their Needs • Ability to see “big picture” elements • Uncomplicated interface • Combination of data sources to form a single output • Accurate reports • Access to near real-time positional data • Clear & concise information • Ability to report back on data errors • Access to latest operating schematics • Accurate positional info • Access to 3rd party data • Red-line tools • Ad-hoc printing • Access to source data • Ability to update data • Ability to create QA/QC reports • Peripheral applications Business Development Technical Services Operations Management
Initial Focal Points… • Pipeline Integrity Assessment Plan • Identify need and gaps between “as-is” and “to be” • Implement phase one • Position for phase two • Integration of Existing Applications with GIS • One Call • Maximo • Provide Tools for Accessibility • Web-based GIS • ROW viewer • Mobile computing solution
Initial Focal PointsPipeline Integrity Assessment Plan… What is the business need… • Create an automated system to manage assessment planning details and replace paper forms. • Develop cost-effective measures for maintaining these details and providing access to various users in the form of paper reports and/or geographic representation (through a GIS interface). • Marry assessment details to subsequent mitigation and remediation activities
Initial Focal PointsPipeline Integrity Assessment Plan… Integrated Components… • Inspection Location • Serves as the integration key value • Sourced from (and owned by) GIS • Reflects “as-is” pipeline configuration • HCA History • Maintained as part of annual HCA program • Helps establish risk • Risk Model • Quantifies priority
Pipeline Integrity Assessment Plan Ledger-based Transactions…
Pipeline Integrity Assessment Plan Systems Connectivity Model… Inspection Location OneCall EAM HCA Assessment Planning RISK G/PRISM ILI PACMAN
Initial Focal PointsWeb-based GIS… Provide Effective Oversight & Controls
Alignment Sheets Operating Schematics ? Queries System Maps Lease Data Standards What has Spectra Energy Changed?As-Built Information… Construction Survey Imagery Work Mgmt Core GIS FRAMME P/L Integ & Risk Gas Measure- ment EDGE & Share Point EWEB OCS (Petris) X-MAP (DeLorme) Reports
What’s Next For Spectra Energy? • New Systems to Better Position Technical Infrastructure • Esri implementation for CORRMGT (Corridor Management) to work alongside Intergraph platform • Raster management utility • Integrated business processes managing information handoff between upstream activities (i.e. E&C) and operation services • Improved Data Mining Tools • Implementation of an executive/management dashboard • Silverlight-based web application • Implementation of operations ROW GIS
What’s Next For Spectra Energy?System Integrations… P/L Integrity Data GPRISM location details E&C Project Data BSDI Project Data Land Base Imagery Graphic Alignment Report Integrity Reports asset details Corridor Mgmt Quads Other Data Risk Assessment EDGEMap Maximo Company Nomenclature Resources Operating Schematics Facilities Reports ROW & Lease Data Alignment Sheets DOT Reports 3rd Party Pipeline Facility Drawings Public Awareness Links & Information One Call System Maps X-MAP 3rd Party Electric Executive/Management Dashboard
Analyze Drill down, exception reports, root-cause analysis, multidimensional analysis Report Detailed operational data Sharing standardized reports ? Monitor Dashboards, scorecards and alerts Plan Create plans, models and scenarios, which are then fed back into the monitoring layer and encoded as targets and thresholds. What’s Next For Spectra Energy?Management Dashboard…
Impact of Changes • Direct Cost Benefits • Net savings in aerial imagery program of 20-30% annual budget of $600,000 (U.S.) • Potential savings of 80% annual operational support budget for Pipeline Integrity activities • 50% reduction in As-Built costs ($300,000 U.S. annually) • Home-grown GIS viewers allow control over application costs • Intangible Benefits • Better situational awareness across enterprise • Improved communication • Improved confidence resulting from better transparency
What is Still a Struggle? • Organizational changes shift momentum • The gap between the central office & the field is still wide • Engineering: the notion that the project ends when the gas starts flowing! • “It’s worked for 20 years – why change now?” • Gaining universal acknowledgement that data IS a company asset • Keeping data confidence high • Like everyone, lots of work/limited resources It IS improving…
Failure to Reach 360!!! No Oversight or Project Mgmt Lack of Data Standards Numerous Data Silos Disconnected Output Few/No Work Processes
360 Success!!! Seamless Decision Support Systems & B.I. GIS Vision & Strategy Mgmt Support & Oversight Integrated Data Systems Uniform Work Processes Data Standards & Nomenclature
Thank You for Your Time!!!QUESTIONS? Matt Thomas Sr. GIS Specialist, Spectra Energy Transmission