Download
1 / 29
290 likes | 313 Vues
Understand the importance of state data for analyzing safety-related issues in traffic accidents and various studies conducted using state data for research purposes.

E N D
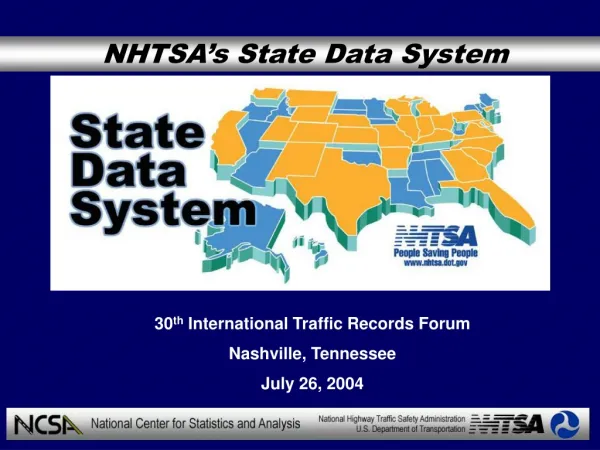
Analysis of Safety Related Issues Using the State Data System by Joseph Tessmer National Center for Statistics and Analysis National Highway Traffic Safety Administration
Japanese Saying • You have to be crazy to eat blow fish. But • You have to be crazy not to eat blow fish.
State Data • You have to be crazy to use state data. But • You have to be crazy not to use state data.
DRL Study 1 • In 2000, we analyzed the effectiveness of Daytime Running Lamps using state data. • Criticized for using several independent states to attempt to estimate DRL effectiveness in non-fatal crashes.
DRL Study 2 • We recently updated the analysis of the effectiveness of Daytime Running Lamps but did not use state data. • Criticized for not using state data due to the large number of crashes within the system that were not exploited.
Project 1 • An Analysis of Fires in Passenger Cars, Light Trucks and Vans, December 1994 • Michigan data • Fires and fuel leak data • Only source of census crash data with information on fuel leakage
Why use state data? • Use the State Data System (SDS) to analyze census data that are not available from other sources.
Problem 1 • Data represents Michigan only. One state is not representative of the entire country. • Data cannot be generalized.
Project 2 • Rural and Urban Crashes: A Comparative Analysis, August 1996, updated 2004 • 1996 Illinois, Pennsylvania, and New Mexico • 2004 Florida and Virginia • With Marilouise Burgess • Provided counts by states
Why not use GES data? • Data from NHTSA’s National Automotive Sampling System – General Estimates System (NASS-GES) • Sample of approximately 57,000 police accident reports • Can not be used • No Rural/Urban Identifier
Criteria for State Selection • Rural/Urban identifier with few unknowns • Different areas of the country • 1996 • Data from 1989 to 1993 available • 2004 • Data from 1990 to 2001 available
Problem 2 • Data cannot be combined in frequency tables if statistical confidence intervals are desired. • Each state has • Different reporting thresholds • Different definitions • Different reporting procedures
Solution • Report results by individual states • Not a national estimate
Number of Vehicles per CrashLarger portion of rural single vehicle crashes
Why use state data? • When census data is desired/required for non-fatal crashes.
Project 3 • A Preliminary Assessment of Crash-Reducing Effectiveness of Passenger Car Daytime Running Lamps (DRLs), June 2000 • Florida, Maryland, Missouri, Pennsylvania • Estimated effectiveness – a ratio
Criteria for State Selection • Make and model information available • Make and model were used to identify vehicles with and without DRLs. • Data from 1995 to 1996 were available at the start of the evaluation.
Effectiveness Definition • Effectiveness = E = 1- (DRL/ CMP) • Effectiveness is a ratio
Care must be taken when combining data acrossseveral statesHowever . . .
Ratios Can Be Combined • Statistical Methods for Rates and Proportions by J. L. Fleiss & John Wiley, 1981 • Combined ratio and their associated confidence intervals are weighted averages of the data.
Why use state data? • When a large number of crashes is desired. • When a small effect needs to be measured. • When census data are desired rather than survey data.
Project 4 • Analysis of Crashes Involving 15-Passenger Vans by Rajesh Subramanian • States chosen: FL, MD, NC, PA and UT • Data sets from several states were concat-enated and design variables were added. • The design variables attempt to adjust for the differences among the states.
Criteria for State Selection • Vehicle Identification Number (VIN) available • Data chosen to be consistent with NHTSA’s Rollover Assessment Program
Design variable limitations • Design variables are defined within the context of a general model. • Models do not need to be linear. • Models can use data from multiple states simultaneously. • Models may be multivariate. • Models may be categorical.
What have we learned? • Pr (Fire|Fuel Leak) = 6% • Rural areas have a larger proportion of single vehicle crashes than urban areas. • Daytime running lamps are associated with a 7% reduction in daytime 2-vehicle opposite direction crashes. • The propensity of a rollover in 15-passenger vans increase as the number of occupants increase.
There are many traffic safety questions State data provide many of the answers!