Download
1 / 17
170 likes | 301 Vues
A Safer Alternative: Cul-de-sacs and Crime in Durham, NC. Chris Whittaker. Introduction. The cul-de-sac is a hallmark of suburban sprawl Advantages: Development of awkward land plots Privacy Less traffic Lower passing vehicle speed Disadvantages: Disconnected communities

E N D
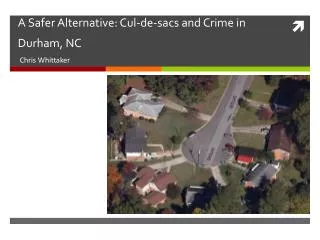
A Safer Alternative: Cul-de-sacs and Crime in Durham, NC Chris Whittaker
Introduction • The cul-de-sac is a hallmark of suburban sprawl • Advantages: • Development of awkward land plots • Privacy • Less traffic • Lower passing vehicle speed • Disadvantages: • Disconnected communities • Encourage automobile use • Produce urban congestion elsewhere • Inefficient provision of public goods
Why cul-de-sacs? • Popular perception of lower crime • Criminals avoid areas with only one exit • Community policing • Little academic research exists • It is difficult to untangle socioeconomic variables from the spatial layout of these communities • However, it remains a useful exercise to conduct natural experiments
Methodology • Identified communities using Google Maps and Zillow • Created 36 cul-de-sac and two-way street pairings • Compared pairings with ~15,000 pieces of criminal activity data • Narrowed to single-family dwellings (note: possible townhomes, though largely removed) • Divided crime into three categories: burglary, larceny and assault
Findings • Yields a 1-to-4.93 cul-de-sac to two-way street crime ratio
Case Study: Pearson Dr. vs. Paladin Ct. • Pearson Drive (~20 homes): 7 crimes committed • 5 Burglary/Breaking and Entering • 1 Simple Assault • 1 Larceny • Paladin Court (8 homes): 1 crime committed • 1 Burglary/Breaking and Entering
Case Study: Bernice St. vs. S Plum St. Same day crime
Case Study: Bernice St. vs. S Plum St. • S Plum Street (~39 homes): 5 crimes committed • 4 Burglary/Breaking and Entering • 1 Aggravated Assault • Bernice Street (~23 homes): 2 crimes committed • 2 Burglary/Breaking and Entering
Case Study: Wyman Pl., Wise Pl., Brownlee Pl. vs. Crowell St.
Case Study: Wyman Pl., Wise Pl., Brownlee Pl. vs. Crowell St. • Crowell Street (~21 homes): 6 crimes committed • 2 Theft from a motor vehicle • 1 Simple Assault • 1 All Other Larceny • 1 Burglary/Breaking and Entering • 1 Theft from a Building • Wise Place, Wyman Place, and Brownlee Place (~17 homes): 0 crimes committed
1818 Crowell Street • Theft from a motor vehicle (larceny) on 4/5/12 • Theft from a building (larceny) on 11/1/12
Discussion • Housing volume and lot size concerns • Selection bias • Spatial permeability • Affluence • Ultimately, correlation does not prove causality
Afterthoughts • Conduct potential future research to better separate spatial and socioeconomic considerations • Add more cul-de-sac communities • Compare findings to similar cities • Expand spatial-criminal research to identify communities with highest level of criminal activity