Download

1 / 18
180 likes | 291 Vues
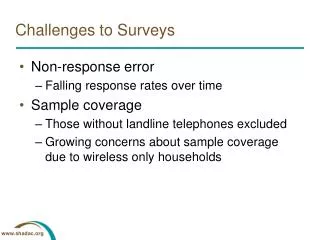
Discover the challenges faced in improving nutrition programming, including case load estimation for severe acute malnutrition, discrepancies in coverage estimates, LQAS sampling methods, and management of program data to enhance effectiveness. Learn how data flow, real-time information, and analysis frameworks can drive program improvements.

E N D
Programme Data and Coverage Surveys Challenges to improve programming UNICEF 2013
Annual estimated caseloads of severe acute malnutrition across the Sahel • In 2010, Nutrition Cluster in countries described their own methods variations of Annual caseload = Pop 6-59 m * Prevalence SAM *Conversion Factor (X) + Safety Margin (X%) • From 2012, a standard calculation used in all countries following calculation defined by Mark Myatt Annual caseload = Pop 6-59 m * Prevalence SAM *Conversion Factor (2.6)
What information is needed for case load estimation of severe acute malnutrition ? • Accurate incidence data from effective large scale programmes • Accurate population and prevalence estimates • Duration of case of severe acute malnutrition as defined by WHZ and MUAC • Velocity of increase or decrease of new cases following seasonal / temporal variation Current Cases of Severe Acute Malnutrition Exits New cases
Mapping ofgeographic coverage of northern Nigerian states 100% of targeted severe acute malnutrition caseload achieved in only ~30 % geographic area of northern states
Comparison of coverage with the severe acute malnutrition caseload in Maradi, Niger in 2011 Estimated number of children 6-59 months of age with severe acute malnutrition in Niger, May 2011 • Prevalence of SAM- WHZ 1.6% in May 2011 • 102,500 SAM cases treated in Maradi in 2011 • Coverage estimates of 24% in Maradi from 5 region coverage survey in 2011 • Assuming no over-reporting the annual caseload corrected by coverage would be – 425,000 cases • Population 6-59m of Maradi ~578,000
Why are there such discrepancies? Inputs to annual caseload estimates • Prevalence of severe acute malnutrition • Population estimates • Prevalence to incidence conversion factor Coverage estimates
LQAS Sampling Methods With coverage estimates, there are no Niger results using other sampling methods to verify those estimates made with S3M methods National level surveys collecting IYCF indicators with LQAS samples • Liberia IYCF results • Nigeria IYCF results
Presentation of data quality indicators into coverage survey reports • Analysis of number of identified cases by data collection points (min, max, mean, median) • Distribution of cases with MUAC < 115mm, Bilateral Oedema, reported appetite • Quality of MUAC measure (accuracy and precision of anthropometrist measures, digit preference, flagged data, use of colored vs non colored MUAC strips) • Age estimation and sex of child • socio-demographic variables of child and or household – comparison to survey data results in households with children with GAM. • Population size of sampling points • GPS validation of survey sampling points • Verification of child in programme with RUTF in HH, treatment programme follow-up cards • Capture / Recapture data analysis
Management of severe acute malnutrition programme data New Admissions, Verification with stocks use
Stocks and programme exits Rapid increase of scale of programme often leads to quality issues. Without programme data, these issues are not addressed. Programme data support: • Integration of management of SAM into regular programme delivery • Ensure lives saved by programme (avoid stock-outs, ensure malaria treatment) • Incorporate preventive interventions (WASH/Nutrition minimum package)
Programme data needs Information Flow Ministry of Health Health Management Information System Department of Nutrition H Real time data on: • New Admissions • Stocks • Programme Exits Without these data, there is no identification or response to critical events that cripple programme delivery. Monthly reports sent by email or on demand Regional Health Supervisors H H District Health Chiefs IFP OTP SFP
To address these data challenges Analysis framework for improved understanding of annual caseloads and programme data compared to coverage estimates Recommendations for what types of programme evaluations should be conducted when. Timely production of results for critical programme management decisions prior to the hunger season. For Coverage Surveys of large scale programmes (national or regional) • Standardized robust and cost appropriate sampling methods • Data collection in one month • Standardized reporting models including data quality measures
Conclusions • Prevention and treatment are two sides of the same coin • Coverage is critical but without quality programme data, coverage estimates are less relevant. • Timely accurate regular coverage estimates should be used to modify and improve programme implementation