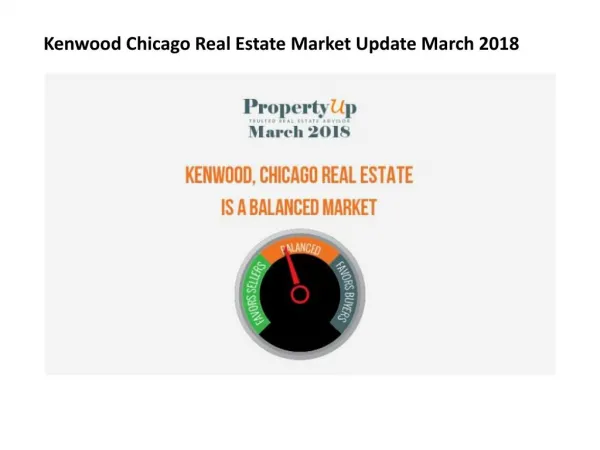
Kenwood Chicago Real Estate Market Update March 2018
Real Estate In Kenwood, Chicago is a balanced market favoring buyers. There is significant amount of homes for sale in Kenwood, Chicago, and buyers are not in a rush to buy yet. There is a 6.53 months supply of inventory on the market in Kenwood, Chicago on March 31, 2018. Now is the Time to Buy! The average market time for a Single Family Homes to sell in Kenwood, Chicago last month was 117 days. It took on average 58 days to sell Kenwood, Chicago Condo, Townhouse or a Duplex. The number of home sales in Kenwood, Chicago from February 1, 2018 through February 28, 2018 was 15 units. That is 1% above the number of homes sold last month in Kenwood, Chicago. The average price per square foot in the area is now $155/Sq.Ft, which is 48% an increase from last month. In Kenwood, Chicago there were 7 units sold in February in the price range between $20,000 – $186,319 with an average of 2.1 bedrooms and 1.4 bathrooms and average Square footage of 1,099SF. In Kenwood, Chicago there were 6 units sold in February in the price range between $186,320 – $738,818 with an average of 3.2 bedrooms and 2.4 bathrooms and average Square footage of 2,435SF. In Kenwood, Chicago there were 2 units sold in February in the price range between $738,819 – $1,125,000 with an average of 7.5 bedrooms and 4.2 bathrooms and average Square footage of 5,750SF. The low price range had the most activity. Homes up to $186,319 were on the market on average 79 days and sold an average of $101,142. If you are looking for a new home for you and your family, or looking for an investment property, you can’t go wrong by getting a prime piece of real estate in Kenwood, Chicago. Search all Kenwood, Chicago homes for Sale on propertyup.com If you are considering viewing Kenwood, Chicago, you may want to do so now!
★
★
★
★
★
90 views • 8 slides