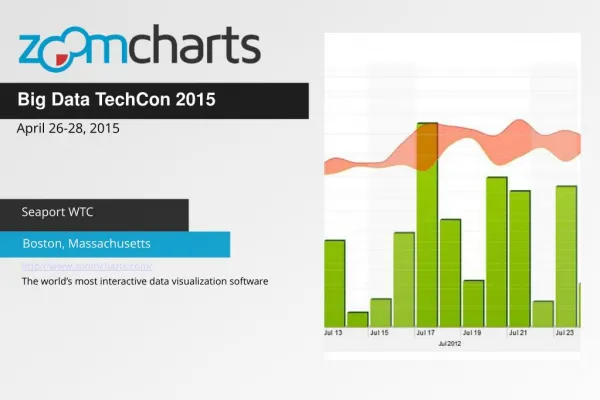
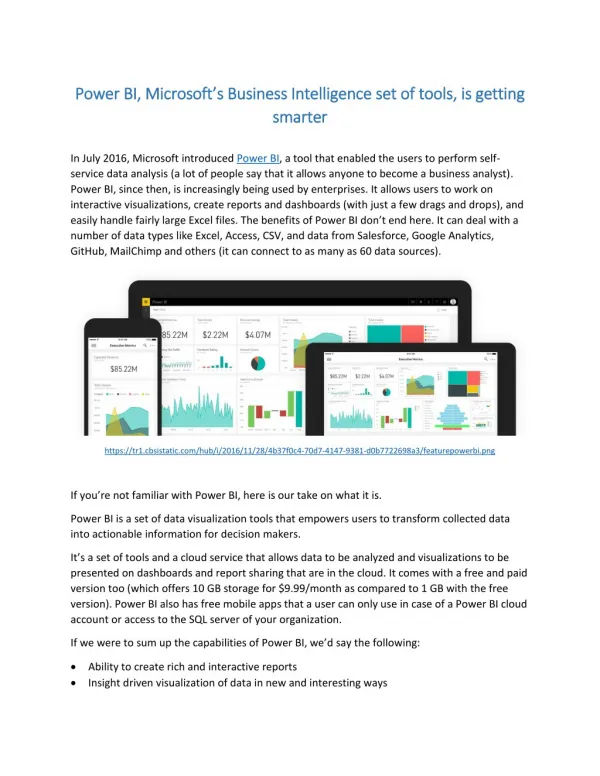
ZoomCharts for Big Data TechCon 2015 Boston, MA
ZoomCharts is offering data visualization tools to support presentations at Big Data TechCon, taking place from April 26th to 28th, 2015 at the Seaport WTC in Boston, Massachusetts.
Check out what you can do with ZoomCharts charts and graphs at http://zoomcharts.com
ZoomCharts’ line of advanced data visualization software is fully interactive, supports big data, works on all modern devices including touch screens, and does it all at incredibly fast speeds. These tools are being discovered by a growing number of clients in a variety of fields as the best way to analyze and present data. Don’t be among the last to discover the exciting potential that ZoomCharts tools can open up for your data.
Big Data TechCon is an annual event offering tutorials, training, and classes on big data, and a chance to network. Now in its fifth year, it features over 55 classes and over 30 expert speakers, perfect for IT professionals, big data professionals, data analysts, business analysts, developers, software architects, data scientists, and project managers. Learn about Hadoop, Spark, YARN, R, HBase, Hive, Predictive Analytics, machine learning, NoSQL, MongoDB, Cassandra, Neo4j, and so much more.
Check out ZoomCharts products:
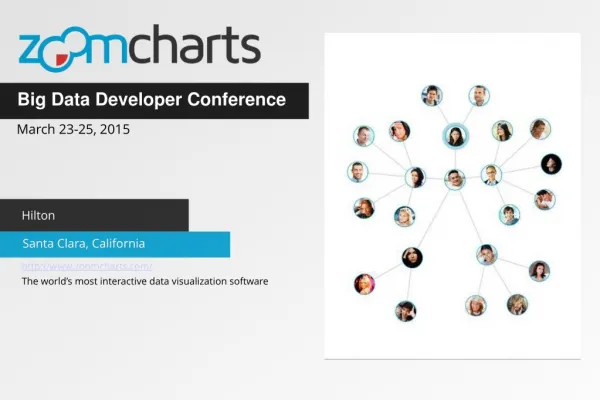
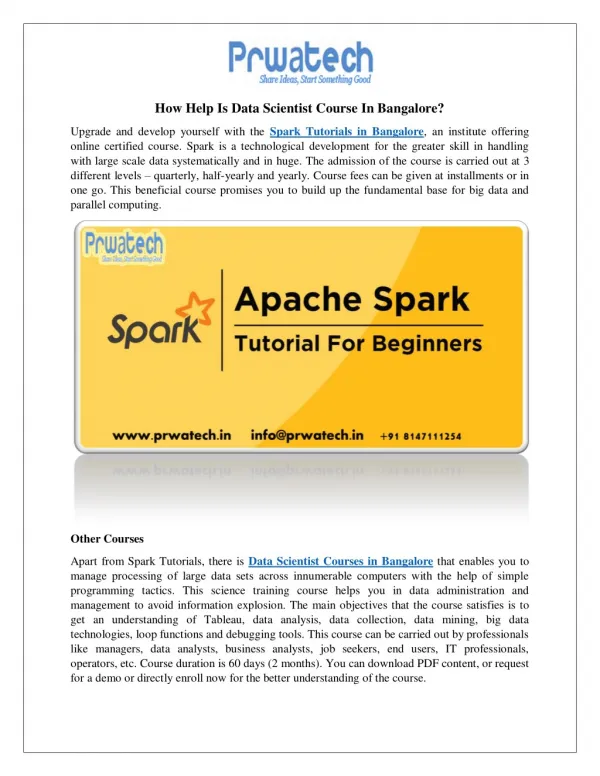
Network Chart
Big network exploration
Explore linked data sets. Highlight relevant data with dynamic filters and visual styles. Incremental data loading. Exploration with focus nodes.
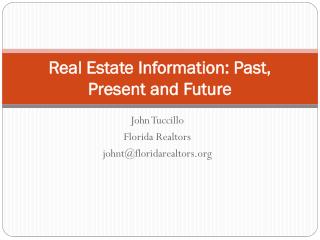
Time Chart
Time navigation and exploration tool
Browse activity logs, select time ranges. Multiple data series and value axes. Switch between time units.
Pie Chart
Amazingly intuitive hierarchical data exploration
Get quick overview of your data and drill down when necessary. All in a single easy to use chart.
Facet Chart
Scrollable bar chart with drill-down
Compare values side by side and provide easy access to the long tail.
ZoomCharts
http://www.zoomcharts.com
The world’s most interactive data visualization software
★
★
★
★
★
209 views • 4 slides