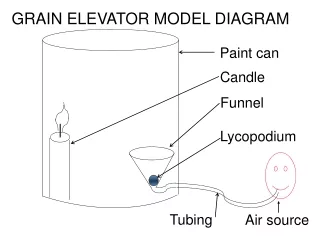
Diagram for the model structures
Diagram for the model structures. Snow Cover and Runoff in Western China Guo-Yue Nu and Zong-Liang Yang The Dept. of Geological Sciences, The University of Texas at Austin. Why Snow?. 1) Snow Cover & climate change

Diagram for the model structures
E N D
Presentation Transcript
Diagram for the model structures Snow Cover and Runoff in Western China Guo-Yue Nu and Zong-Liang Yang The Dept. of Geological Sciences, The University of Texas at Austin
Why Snow? 1) Snow Cover & climate change Snow cover has strong interactions with climate change due to its properties such as high albedo, low thermal conductivity, and striking seasonality. 2) Snow Cover & water resources Snow melt induced runoff/streamflow is one of the most important water resources in late spring and even in summer seasons in Western China. 3) Snow Cover - an indicator of climate change Variation of mountainous snow cover and glacier is directly an indicator of global/regional climate change. 4)Snow Cover & Asian Monsoon Snow Cover and Asian Monsoon circulation have negative correlation
Datasets used in this study Monthly AVHRR snow cover (11/1966-05/2003) AVHHR (Advanced Very High Resolution Radiometer) Northern Hemisphere EASE-Grid Weekly Snow Cover product, globally regridded to 1˚x1˚ Monthly USAF/ETAC snow depth climatology US Air Force / Environmental Technical Applications Center global snow depth climatology at 1˚x1˚ Monthly UHN-GRDC runoff climatology The University of New Hampshire-Global Runoff Data Center global runoff climatology at 0.5˚x0.5˚ 3-hourly GSWP2 atmospheric forcing data Global Soil Wetness Project (1983-1995) global precipitation (rainfall and snowfall), short-wave, long-wave, surface air temperature, humidity, pressure, and wind speed at 1˚x1˚ to drive land surface model; Soil and vegetation parameters at 1˚x1˚
Versatile Integrator of Surface Atmosphere (VISA) Model • VISA Land surface model is a modification of the NCAR Land Surface Model version 1.0 • 1. Main Features of NCAR LSM 1.0 (Bonan, 1996) • Six soil layers underlying one canopy layer • Mosaic vegetation distribution (28 surface types composed of 14 plant functional types) • 2-stream radiation scheme • Carbon uptake (Farquhar et al.,1980) • Stomatal conductance model (Ball, 1988) 2. New Features of VISA (Yang and Niu, 2003) • Soil moisture computation scheme from CLM (Yang, 1998) • TOPMODEL for runoff production (Niu and Yang, 2003) • Three-layer physically based snow sub-model (Niu and Yang, 2003) • Vegetation Dynamics (Dickinson et al. 1998)
Community Land Model version 2.0 (CLM2.0) • The Community Land model (CLM) has been developed for community use by a grass-roots collaboration of scientists who have an interest in making a general land model available for public use (Dai et al., 2001) • Layering: 10 unevenly spaced layers for soil temperature and soil moisture (Yang and Dickinson, 1998); • Cold Season Processes: a multi-layer parameterization of snow processes and frozen soil; • Runoff: a runoff parameterization following the TOPMODEL concept (Yang and Niu, 2003); • Canopy: a canopy photosynthesis-conductance model that describes the simultaneous transfer of CO2 and water vapor into and out of vegetation following Bonan (1996); • Mosaic: a tiled treatment of subgrid fraction of energy and water balance, with up to 7 tiles (4 plant functional types, 1 wetland, 1 lake, 1 glacier) CLM2 and VISA have many common features except for number of soil/snow layers, turbulent transfer, and subgrid tiles’ treatment.
Spatial Distributions of AVHHR snow cover 2003 FEB AVHRR Snow Cover Fraction (%) 2003 MAY AVHRR Snow Cover Fraction (%) Most part of North Hemisphere land is covered by snow in February. Snowline recedes northward obviously after three months in May except for Tibetan area.
30-year variation of North Hemisphere snow cover 0 North Hemisphere snow cover decreased about two million square km, 1/5 of China, since 1987 up to now associated with global warming.
30-year variation of Western China snow cover Western China including Tibet Western China snow cover decreased apparently from 1983 to 2002 except for the period from the winter of 1997 to the spring of 1998, especially for spring, summer, and fall seasons. This might be related to regional warming or snowfall decreasing induced by regional circulation.
30-year variation of Northwestern China (including north Tibet) snow cover GSWP2 covered period (1983-1995) For the GSWP2 period, obviously 1990, 1992 and 1994 are relatively less-snow years. We conducted model simulations by using GSWP2 forcing data from 1983-1995, and analyzed the results from 1986-1995.
Modeled FEB snow depth in comparison with that of USAF/ETAC The spatial distributions of the VISA and NCAR CLM2 modeled 10-year mean (1986-1995) snow depth in February are very similar to that of USAF/ETAC. Both VISA and CLM2 produced more snow in North Europe and East Siberia due to overestimated GSWP2 snowfall in these regions. Overall, both models produced snow depth in better agreement with USAF/ETAC in North America than in Eurasia. It seems VISA model produces more snow than CLM2, but both models produce less snow in Tibet area. Northwestern China (35-45N, 70-105E)
Modeled 10-year Mean Runoff in comparison with that of UNH-GRDC Northwestern China (35-45N, 70-105E) Both VISA and the NCAR CLM2 capture the basic pattern of the GRDC observed runoff in May. The runoff in May is mainly induced by snow ablation especially for north of 40N. Both modeled and GRDC observed snow ablation induced runoff in Northern Europe and Russia can be over 8mm/day or say, 240mm/month. This large amount of runoff may generate flood.
Modeled Regional Averages of Snow depth in comparison with that of USAF/ETAC Both models produced more accurate snow depth in North America, Western and Eastern US than in Eurasia, possibly due to the GSWP2 overestimated snowfall in Eurasia. VISA model produces more snow than CLM2 and in better agreement with that of USAF/ETAC in Northwestern China. Both models produce more snow in Northeastern China and the whole continent of Eurasia.
Regional Averages of Runoff Both models captured the runoff seasonality in all these regions. In Northwestern China, CLM2 produced higher runoff and in closer agreement with GRDC runoff. However, GRDC runoff is still questionable in this region due to limited streamflow data used to derive gridded runoff field. Actually, we need more long term streaflow records in Northwestern China.
Interannual variations in Northwestern China (1986-1995) Both models produced decreasing snow depth, snow water equivalent (SWE), and runoff since 1991, which is consistence with the AVHRR snow cover change. VISA produced deeper snow than CLM2, however, CLM2 produced more runoff than VISA, because VISA simulated more evaporation than CLM2 due to different turbulent transfer scheme used in the two models. 91 92 93 94 95 Month since January of 1986
GSWP2 yearly precipitation The main cause to the decreasing snow depth may be attributed to the decreasing snowfall. The decreasing runoff may be attributed to the decreasing snow depth and rainfall.
Conclusions 1) The snow cover in Northwest Chinadecreased apparently from 1983 to 2002 especially for spring, summer, and fall seasons. This might be related to regional warming or decreasing snowfall induced by regional circulation. 2) Both VISA and the NCAR CLM2 have the capability for simulating global continental snow and runoff. 3)Both VISA and CLM2 models produced decreasing snow depth, snow water equivalent (SWE), and runoff from 1991 to 1995 for the period of 1986-1995, which is consistence with the AVHRR snow cover change. 4) The decreased snow depth and snow cover may be attributed to decreasing snowfall, and the decreasing runoff may be attributed to decreasing precipitation.
Problems and Ongoing work Problems : Urgent need of regional or in-situ snow depth or snow water equivalent data, streamflow/runoff records and precipitation data in Northwestern China. Ongoing work: 1) Tracking water vapor movement using Back-Trajectory method to study regional water recycling characteristics (Almost done). 2) Analyzing the NCAR CAM2/CLM2 coupled with observed SST 1979-2000 simulations. 3) Working on WRF model outputs and coupling with VISA.