Coming to Closure Subset Selection
130 likes | 150 Vues
Explore different variable subset selection methods including stepwise, backwards, and all-subsets to determine the best model for generalization. Measure model performance using statistics such as ROC plots and Schwarz Bayes Criterion.

Coming to Closure Subset Selection
E N D
Presentation Transcript
/*where we left off after variable screening*/ %let screened= MIPhone MICCBal Dep MM ILS MTGBal Income POS CD IRA brclus1 Sav NSF Age SavBalLOCBalNSFAmt Inv MIHMValCRScore MIAcctAgInvBalDirDepCCPurc SDB CashBkAcctAgeInAreaATMAmtb_DDABal DDA brclus2 CC HMOwnDepAmt Phone ATM LORes brclus4; Which ones for the final model?
The most thorough search would consider all possible subsets. This can be prohibitively expensive when the number of inputs, k, is large, as there are 2k possible subsets to consider.
The conventional wisdom regarding computation time is thatstepwise < backwards < all subsets. Logistic regression (as implemented by PROC LOGISTIC) gives a different story. For up to 60 inputs, the results are reversed all subsets < backwards < stepwise. For any number of inputs, backward elimination (with the FAST option) is more efficient than stepwise. All-subsets selection is executed in PROC LOGISTIC with the SELECTION=SCORE option (SAS Institute Inc. 1997). This method only requires that one model be fit (the full model).
All Subsets Stepwise Time Fast Backward 25 50 75 100 150 200 Number of Variables Scalability in PROC LOGISTIC • (Simulation with 50,000 cases and 200 intercorrelated inputs; 16 of the inputs were important, 6 strongly so.)
/*where we left off after variable screening*/ %let screened= MIPhone MICCBal Dep MM ILS MTGBal Income POS CD IRA brclus1 Sav NSF Age SavBalLOCBalNSFAmtInvMIHMValCRScore MIAcctAgInvBalDirDepCCPurc SDB CashBkAcctAgeInAreaATMAmtb_DDABal DDA brclus2 CC HMOwnDepAmt Phone ATM LORes brclus4; /*note that res is a character variable*/ proclogisticdata=d.develop_a; class res (param=ref ref='S'); model ins(event='1')=&screened res / clodds=pl selection=backward fastslstay=.001; run;
/*where we left off after variable screening*/ %let screened= MIPhone MICCBal Dep MM ILS MTGBal Income POS CD IRA brclus1 Sav NSF Age SavBalLOCBalNSFAmtInvMIHMValCRScore MIAcctAgInvBalDirDepCCPurc SDB CashBkAcctAgeInAreaATMAmtb_DDABal DDA brclus2 CC HMOwnDepAmt Phone ATM LORes brclus4; /*score doesn’t allow class variable so create indicators by “hand”; */ datad.develop_a; setd.develop_a; resr=(res='R'); resu=(res='U'); run; proclogisticdata=d.develop_a; model ins(event="1")=&screened resrresu / selection=score best=1; run;
/*where we left off after variable screening*/ %let screened= MIPhone MICCBal Dep MM ILS MTGBal Income POS CD IRA brclus1 Sav NSF Age SavBalLOCBalNSFAmtInvMIHMValCRScore MIAcctAgInvBalDirDepCCPurc SDB CashBkAcctAgeInAreaATMAmtb_DDABal DDA brclus2 CC HMOwnDepAmt Phone ATM LORes brclus4; /*When the SELECTION=SCORE option is used, output data sets are not available. Use the ODS to create an output data set with the score statistic and the number of variables. */ odsoutputNObs=NObs bestsubsets=score; proclogisticdata=d.develop_a; model ins(event="1")=&screened resrresu / selection=score best=1; run; procprintdata=nobs; procprintdata=score; run;
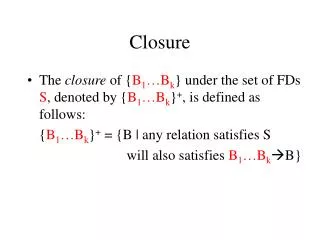
Schwartz Bayes Criterion • Smaller values of SBC are better. • The score test statistic is asymptotically • equivalent to the likelihood ratio statistic. • An SBC type statistic can be computed • from the score statistic as • –(score) + (k+1)*ln(n)
/*Schwarz Bayes criterion */ data_NULL_; setNObs; where label = 'Number of Observations Used'; callsymput('obs',n); run; data subset; set score; sbc=-scorechisq+log(&obs)*(numberofvariables+1); run; procprintdata=subset; varsbcvariablesinmodel; run;
procsql; selectVariablesInModelinto :selected from subset havingsbc=min(sbc); quit; %put &selected;
Run the selected model proclogisticdata=d.develop_adescendingplots=roc; model ins=&selected; run;
Automatic Selection Routines For techniques like stepwise selection and backward elimination, what are good stopping rules? For best subsets, what number of inputs yields the best model? The goal of most predictive modeling is generalization. Hence, the best model is the model that generalizes to new cases the best. How does one measure generalizing ability of a model? What are some statistics that summarize a model’s performance?