Download
1 / 27
280 likes | 442 Vues
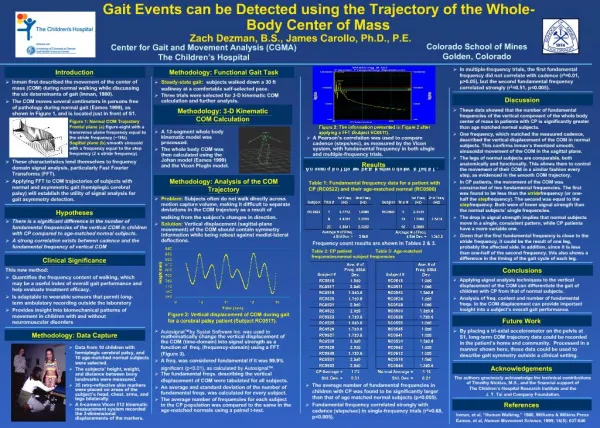
What are the IMPACTS of Climate Change on Asphalt Concrete Pavements?. Analyzing Global Warming on Linear Infrastructure using NARCCAP data sets: A Case Study in the Northeastern U.S. Jennifer Jacobs Ph.D., P.E. William C. Meagher III Jo Sias Daniel Ph.D., P.E. Ernst Linder Ph.D.

E N D
What are the IMPACTS of Climate Change on Asphalt Concrete Pavements? Analyzing Global Warming on Linear Infrastructure using NARCCAP data sets: A Case Study in the Northeastern U.S. Jennifer Jacobs Ph.D., P.E. William C. Meagher III Jo Sias Daniel Ph.D., P.E. Ernst Linder Ph.D.
System Uncertainty Propagation Framework Failure Threshold Failure Threshold 2
Motivation & Implications • The U.S. spends nearly $200,000,000 per day building and rebuilding roads • Driving delays are expected to waste 7.3 billion gallons of fuel per year over the next two decades, increasing travelers’ costs by $41,000,000,000, and add 73 million tons of carbon dioxide to the atmosphere. • Climate is an important consideration in three major road deterioration processes: thermal cracking, frost heave and thaw weakening, and rutting. • Almost no literature exists to guide roadway design in light of climate change (Mills et al. 2007; Meagher et al. 2012)
Q. Why NARCCAP? A. RCM Datasets Source: http://www.narccap.ucar.edu • Spatial Resolution • ~ 50 x 50 km pixels • North America • Temporal Resolution • Current : 1970 – 2000 • Future: 2040 – 2070 • 30 to 100 Year Records • 3-Hourly, Daily, & Weekly
Pavement DesignMechanistic-Empirical Pavement Design Guide (M-E PDG) • Mechanistic modeling based on material behavior including: • the relationship between stress and strain, • the time dependency of strain under constant stress, and • the ability of the material to recover strain after stress removal. • The “empirical” approaches are: • characterization of materials and traffic • relation of stresses and strains to observed damage (field performance) Source: Mechanistic-Empirical Pavement Design Guide
Pavement Model Considerations Materials, traffic, & the environment • Endogenous Variables : Materials • Bound Layers • Unbound Layers • Exogenous Variables: Nonstationary Traffic • Volume and Trends • Axel Load Distribution • Exogenous Variables: Stationary Climate • Temperature, % sunshine, wind, relative humidity and precipitation
Enhanced Integrated Climatic Model (EICM) • EICM output is used in structural response models to • Compute stresses, strains, and displacements • Predict pavement performance and deterioration over time 8 One-dimensional coupled heat and moisture flow model consisting of: The Climatic-Materials-Structural Model (CMS Model), The CRREL Frost Heave and Thaw Settlement Model (CRREL Model), and The Infiltration and Drainage Model (ID Model).
Methodology • Objectives: • Develop and Test Methodology • Apply Methodology to New England Sites
Step 1: Model Point Selection • CRCM + CGCM3: Canadian Regional Climate Model (CRCM) combined with the Canadian Global Climate Model version 3 (CGCM3) AOGCM. • RCM3 + CGCM3: Regional Climate Model version 3 (RCM3) combined with the Canadian Global Climate Model version 3 AOGCM. • RCM3 + GFDL: Regional Climate Model version 3 combined with the Geophysical Fluid Dynamics Laboratory Climate Model version 2.1 (GFDL) AOGCM
Step 2: Conversion of Climate Data NARCCAP M-E PDG RCM Temperature (K) Temperature (°F) Precipitation (kg m2 s-1) Precipitation (in) Zonal + Meridional Wind Speed (m s^-2) Wind Speed (mi h-1) Downwelling Shortwave Radiation (W m^-2) Percent Sunshine Specific Humidity (kg kg-1) + Surface Pressure (Pa) Rel. Humidity (%) 3-Hourly Hourly
Approach:Cumulative Distribution Function Transformation (CDF-t) (Michelangeli et al., 2009) (1) (2) (3) (4) (5) Step 3: Downscaling
Historical Historical Historical Historical
Future Future Future Future
Methodology – Step 5Execute the M-E PDG • Performance Grade Asphalt • Secondary: PG 58-28 • Interstate: PG 64-28 • Average Annual Daily Traffic Count • Secondary: 6,500 • Interstate: 25,000 • 20-Year design life • 1980 – 2000 • 2050 - 2070
Berlin Boston ResultsHindcast Model versus Baseline Horizontal lines at 0.25 inch and 0.50 inch indicate acceptable levels of distress for AC rutting. Concord Portland 18
ResultsFuture Model versus Hindcast ModelDifference in Time to Distress (Future - Hindcast) in Months. Negative values indicate distress occurs earlier. 23
Conclusions • The simulated impact of future temperature changes on pavement performance was • Negligible for alligator cracking for the four study sites • AC rutting differences were great enough to warrant additional consideration • Adequate evidence exists to recommend the inclusion of a nonstationary climate in design • Proposed methodology provides a consistent and flexible means to evaluate the impact of other variables alone or in combination.
Conclusions • In lieu of pavement community datasets, North American Regional Climate Change Assessment Program’s (NARCCAP) climate change simulations are invaluable • Sustainability depends on multi-institution collaborations to support the integration of climate science forecasts into engineering research for transportation infrastructure • In contrast to popular opinion We Are NOT All Engineers when it comes to delivering Useful Projections Of Climate and Sea Level Rise
Pathway Impacts of Climate Change Climate (C) Water System Loadings (W) Infrastructure Response (I) Thermal Expansion Inundation Pavement Deterioration Road Washout Bridge Failure Precipitation Temperature Sea Level Elevation Hurricane Freq./Intensity River Stage Freeze/Thaw Bed Stress Scour Morphologic Evolution 26
Questions http://learningtoflyoriginals.com/flood.html