Download
1 / 25
250 likes | 447 Vues
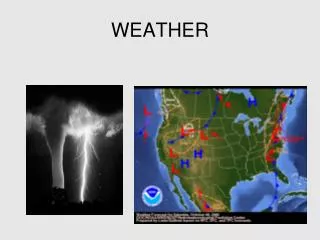
Careful how you measure that wind shear!. Rob Scott The University of Texas at Austin Institute for Geophysics Jackson School of Geosciences . Wind shear is important for hurricane formation.

E N D
Careful how you measure that wind shear! Rob Scott The University of Texas at Austin Institute for Geophysics Jackson School of Geosciences
Wind shear is important for hurricane formation • “wind shear” is the magnitude of the difference between low level winds (850mb) and upper level winds (200mb) • strong wind shear inhibits hurricane formation (DeMaria 1996, DeMaria and Kaplan 1994) Rob Scott, UTIG
Can wind shear explain multidecadal variability of hurricane activity? • Goldenberg et al. 2001 measured the fraction of a region in the hurricane formation region (MDR) with shear less than 6 m/s. • Averaged over August September October Rob Scott, UTIG
Goldenberg et al. 2001 Fig.2 Rob Scott, UTIG
Reproduce Goldenberg et al. fig.3 Rob Scott, UTIG
Goldenberg et al. 2001 Fig.1 Rob Scott, UTIG
Which is right? • Imagine you’re a hurricane, you feel the shear on that day. Rob Scott, UTIG
Is wind shear changing? Fraction of MDR with wind shear less than 6m/s Rob Scott, UTIG
They conclude … shear does it! “For influencing activity on interannual time scales, this local [SST] effect plays either a negligible role (for major hurricanes) or at best a secondary role (for all hurricanes) (Shapiro & Goldenberg,1998).The dominant local factor for tropical cyclone activity is the magnitude of the vertical shear of the horizontal wind between the upper and lower troposphere, |Vz|.” Rob Scott, UTIG
How should we characterize shear? • Is probability of hurricane formation linearly proportional to shear? • Or is it a step function? Rob Scott, UTIG
Summary: order of operations important • First time average winds, then calculate magnitude of shear, then fraction of MDR < threshold • First calculate magnitude of shear, then fraction of MDR < threshold, then time average. Rob Scott, UTIG
Part II: • You can’t make predictions if you don’t understand what’s generating the variability Rob Scott, UTIG
“The Recent Increase in Atlantic Hurricane Activity: Causes and Implications” Goldenberg, Landsea, Mestas-Nuñez, Gray, 2001, Science • “The greater activity results from simultaneous increases in North Atlantic sea-surface temperatures and decreases in vertical wind shear. Because these changes exhibit a multidecadal time scale, the present high level of hurricane activity is likely to persist for an additional ~10 to 40 years.” Rob Scott, UTIG
Existence of preferred timescales doesn’t imply enhanced predictability • Proved this for particular stochastic climate model (Scott, J. Clim. 2003) • Predictability is enhanced when deterministic forcing drives greater portion of variance, stochastic variance drives lesser portion of variance (Scott and Qiu, J. Clim. 2003). Rob Scott, UTIG
Saravanan and McWilliams Model (J. Clim. 1998) • Simple 1D extension of Hasselmann model • Atmospheric forcing stochastic in time, but coherent in space, large scale • where the SST anomaly and stochastic forcing are now functions of latitude, y; the advecting velocity, V, is a uniform constant Rob Scott, UTIG
SST Power spectra, V=0.1, at two latitudes Rob Scott, UTIG
Which had greater predictability? • Solid line (maximum predictability -- roughly 4 x red-noise predictability) • Dashed line (minimum predictability – roughly ½ x red-noise predictability) Rob Scott, UTIG
Predictability vs. latitude Thick line: MSE=1/2 VAR Rob Scott, UTIG
Another example: SST power spectra when V=1 Rob Scott, UTIG
Predictability: • Slightly less red spectrum -- solid line (maximum predictability: 1.2 x red-noise predictability) • Slightly more red spectrum -- dashed line (minimum predictability: 0.57 x red-noise predictability) Rob Scott, UTIG
Lesson from 1d stochastic model • Predictability can be subtle! • You can’t judge predictability from the power spectrum! • You must know what’s driving the variability (Scott and Qiu, 2003). • 1d model, can understand the predictability in terms of a stochastic cancellation of errors (Scott, 2003). Rob Scott, UTIG
Recall they state: • “Because these changes exhibit a multidecadal time scale, the present high level of hurricane activity is likely to persist for an additional ~10 to 40 years.” • I don’t think this is justified. Rob Scott, UTIG
Summary • Characterizing wind shear by fraction of area less than a threshold (here 6 m/s) results very sensitive to order of operations! • Using daily winds, not changing significantly over the North Atlantic main development region. Rob Scott, UTIG
From Wikipedia • The gambler's fallacy is a logical fallacy involving the mistaken belief that past events will affect future events when dealing with random activities, such as many gambling games. It can encompass any of the following misconceptions: • A random event is more likely to occur because it has not happened for a period of time; • A random event is less likely to occur because it has not happened for a period of time; • A random event is more likely to occur because it recently happened; and • A random event is less likely to occur because it recently happened. Rob Scott, UTIG
Correlation between major hurricane frequency and AMO SST • r = 0.72, after 5-yr running mean is taken (11 degrees of freedom, just significant at 99% level) Rob Scott, UTIG