Gain/Duplication/Loss
160 likes | 310 Vues
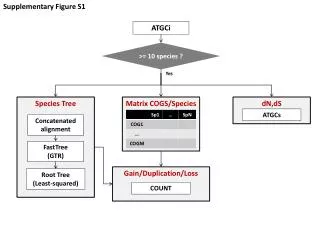
Supplementary Figure S1. ATGCi. >= 10 species ?. Yes. Species Tree. Matrix COGS/Species. dN,dS. ATGCs. Concatenated alignment. FastTree (GTR). Gain/Duplication/Loss. Root Tree (Least-squared). COUNT. Supplementary Figure S2. a). b). c). d). Supplementary Figure S3. a).

Gain/Duplication/Loss
E N D
Presentation Transcript
Supplementary Figure S1 ATGCi >= 10 species ? Yes Species Tree Matrix COGS/Species dN,dS ATGCs Concatenated alignment FastTree (GTR) Gain/Duplication/Loss Root Tree (Least-squared) COUNT
Supplementary Figure S2 a) b) c) d)
Supplementary Figure S3 a) b) c) d)
Supplementary Figure S6 c) • Median gain rates: • All branches: 10,280 • Depth < 0.05: 20,559 a) d) • Median loss rates: • All branches: 29,309 • Depth < 0.05: 51,168 e) b) • Median reduction rates: • All branches: 1,213 • Depth < 0.05: 2,009 f) • Median expansion rates: • All branches: 1,538 • Depth < 0.05: 1,538
Supplementary Figure S7 R = -0.53 p = 0.0009
Supplementary Figure S8 a) b) c) d)
Supplementary Figure S9 a) b) c) d)
Supplementary Figure S10 a) b) c) d)
Supplementary Figure S11 a) c) b)
Supplementary Figure S12 a) b) c) d)
Supplementary Figure S13 a) b) c) d) e) OPEN
Supplementary Figure S14 a) b) R = 0.61 p = 0.0185 R = -0.73 p = 0.0481 R = -0.71 p = 0.0006 c) d) R = -0.45 p = 0.0225
Supplementary Figure S16 a) Reduction Expansion Expansion Gain Loss gain + (n/) + (n/) … n n loss Reduction 0 1 2 3 b) Possible HGT