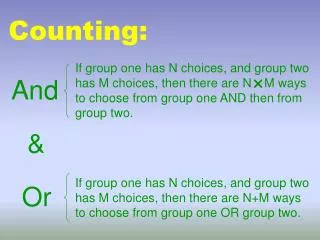
Counting Rules
Counting Rules. Probability Distributions. Describe entire populations X = all items in the probability space P(X) = probabilities are relative frequencies for all outcomes in the probability space 0 ≤ P(X) ≤ 1, for each outcome in the probability space
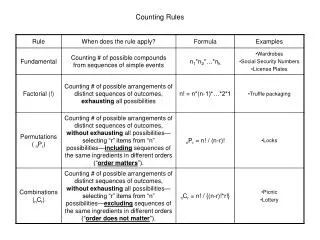

Counting Rules
E N D
Presentation Transcript
Probability Distributions • Describe entire populations • X = all items in the probability space • P(X) = probabilities are relative frequencies for all outcomes in the probability space • 0 ≤ P(X) ≤ 1, for each outcome in the probability space • SP(X) = 1, over all outcomes in the probability space • Population mean, m = S {X*P(X)} • Population variance, s2 = S{X2*P(X)} – m2
Example of a discrete probability distribution Population variance s2 = 7.1 – 4 = 3.1
Binomial Populations • Discrete, numerical population • Counts of “successful” trials in a mutually exclusive sequence of length “n”. • The sequences are made of “n” independent and identical binomial trials. • Binomial trials are categorical simple events • Binomial trials have 2 complement outcomes • Identical trials means that each trial has the same probability, “p”, of a success.
.08 = p .08 = p .08 = p homerun homerun homerun NOT homerun NOT homerun NOT homerun .92 = 1-p .92 = 1-p .92 = 1-p n = 15 … Binomial example A baseball player has a probability of hitting a homerun in each at bat of (p=) .08. In a given road trip, this player gets (n=) 15 at bats.
Binomial populations in excel • Binomial probability formula: P(x): “=binomdist(x,n,p,false)” • x = # of successes in n trials • n = # of trials in the binomial sequence • p = probability of a success in a trial • false = logical value to compute marginal, rather than cumulative probability.
Binomial example A baseball player has a probability of hitting a homerun in each at bat of (p=) .08. In a given road trip, this player gets (n=) 15 at bats. Question: what is the probability that this ball player hits 2 homeruns in this road trip? Answer: plug in excel the following information … =binomdist(2,15,.08,false) … and you will get …. 0.227306
Binomial parameters • Population mean, m: m = n*p • Population variance, s2: s2 = n*p*(1-p)
Examples of parameter computations • For the baseball player in the previous example, we expect the player to hit an average of 1.2 (=15*.08)homeruns during his road trip, give or take 1.05 (=square root of 15*.08*.92) homeruns.
Finding binomial probabilities: statcrunch • You can also compute binomial probabilities in Statcruch: • STAT • CALCULATORS • BINOMIAL • SELECT n and p • SELECT x to be the appropriate binomial count value • SELECT the appropriate algebraic symbol: =, >, <, ≤, or ≥ • COMPUTE • Or you can use the excel formula: BINOMDIST(X, N, P, false= or true≤)