Download
1 / 32
320 likes | 503 Vues
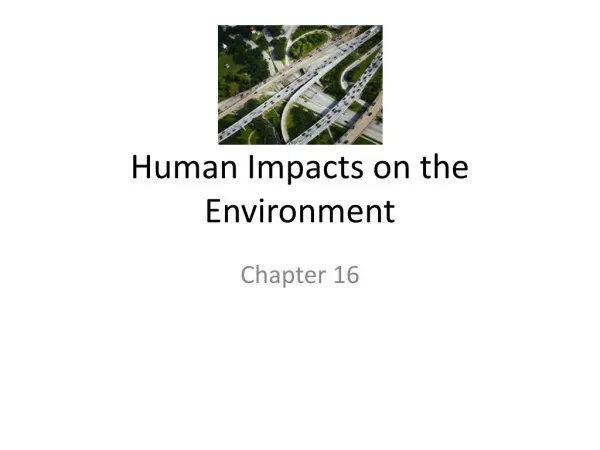
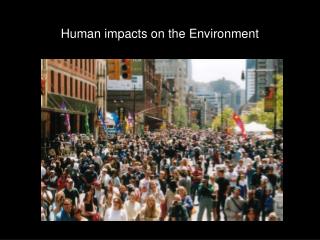
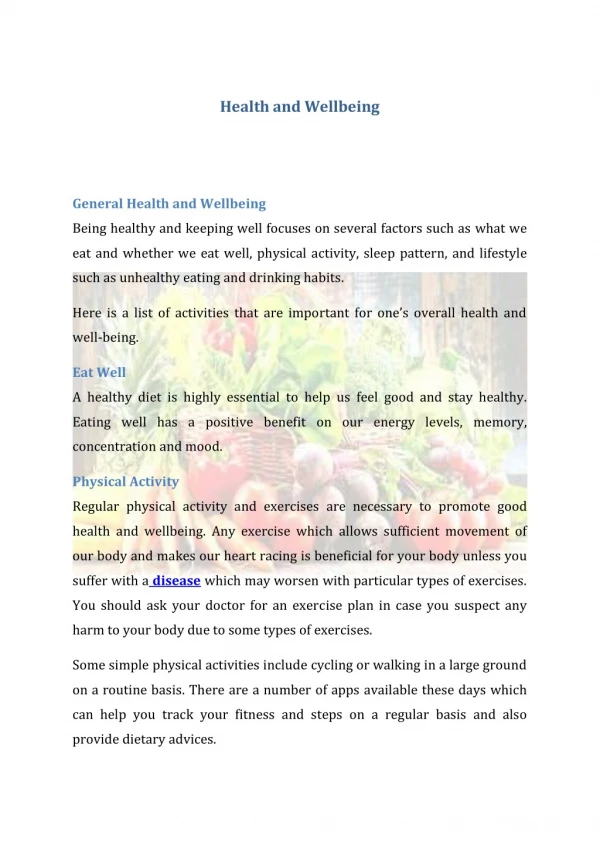
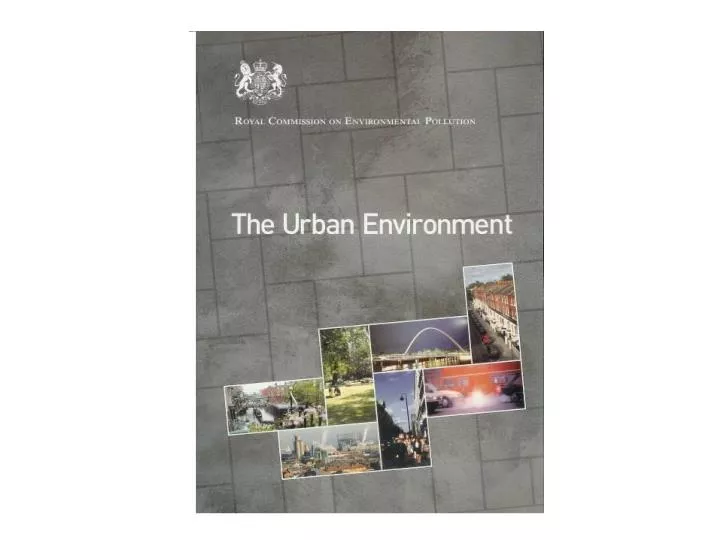
The Urban Environment Impacts on Health and Wellbeing. A successful urban area stimulates those who live and work there and reinforces self-esteem. The urban environment affect health and wellbeing of everyone who lives and works there.

E N D
The Urban Environment Impacts on Health and Wellbeing A successful urban area stimulates those who live and work there and reinforces self-esteem. The urban environment affect health and wellbeing of everyone who lives and works there. Many problems are concentrated in the most deprived areas where environmental, social and economic factors interact especially children and older people. Relationship between health, wellbeing and place are complex interacting and poorly understood.
Effects of Urban Environment on Health • Air pollution: 24,000 deaths/yr brought forward by~8 months and 24,000 hospital admissions. • Traffic accidents: 3,300 deaths and 29,000 serious injuries/yr. • Climate: Winter - 25,700 extra deaths Dec 2005-March 2006. Summer - 2,000 excess deaths in heat-wave of 2003. • Mental health: Strong association between urban residence and psychiatric disorders. • Infectious disease: Spread of pandemic flue and new diseases with climate change. • Obesity: 34,000 extra deaths each year.
The London Smog of December 1952 Clean Air Act of 1956
AIR POLLUTION PARTICLES AND THE LUNG • 1,000,000,000,000 particles enter into lungs daily • 10,000 lts of air pass through the lungs every 24 hours. • Surface area exposed to the external environment - 150 m2
Mortality Hospitalisation Symptoms Decreased lung function Total Cough FEV1 COPD PEF Resp All resp. Asthma Asthma Pneumonia Upper resp Lower resp Cardiovascular Cardiovascular Percentage Change in Health End-point for a 10mg/m3 Increase in PM10 (summarised from over 100 studies) 4 3 % Increase 2 1 Adverse health effects of particles persist after controlling for smoking
Meta-analysis of TSP & cardiovascular mortality Anderson R et al *
Cardiovascular Mortality: PM2.5 and Black Smoke:Long-term Exposure PM2.5 Black Smoke * * Relative risk of all cause mortality per 10 mg/m3 change in annual average PM2.5: 1.06 (95% CI:1.02-1.11)
Mean High PM10 100 Mean PM10 250 Ages 0-17 80 200 Hospital Admissions Asthma + Bronchitis 60 150 PM10 (mg/m3) 40 100 20 50 0 0 Dec - Feb Dec - Feb Dec - Feb Sep - Nov Sep - Nov Sep - Nov Dec - Feb Dec - Feb Dec - Feb Sep - Nov Sep - Nov Sep - Nov 1985-86 1986-87 1987-88 1985-86 1986-87 1987-88 Ni Pb Zn Cu Fe 0 100 200 300 0 100 200 300 0 100 200 300 Concentration (ppb) Asthma & Bronchitis Associated with PM10 Influence of Closing and Reopening a Steel Mill in Utah Valley Pope, Am J Public Health 1989
Emission of nitrogen oxides, sulphur dioxide, ammonia and non methyl VOC from anthrop0genic sources by sector in the UK
Proportion of diesel vehicles in car fleet COUNTRYDIESEL CARS (%) Austria 54% Belgium 52.2% Spain 47.3% France 40.2% Italy 22.5% Holland 20.3% Portugal 18.8% Germany 17.6% UK 15.3% Sweden 11.0% EUROPEAN MEAN 25.3%* * Forecast to increase to 50% by 2010 (D’Amato et al, Clin Exp Allergy 2000; 30: 628-636)
Temporal trend in sulphur dioxide emissions by source category in Hong Kong
Photochemical smogincluding OZONE Sunshine NO2 + radiation NO + O O + O2 O3 RO2 + O2 RO + O3 Pollutants
Percentage change in PM10 emissions in selected European countries between 1990 and 2001
The web of connections between increased car ownership and use and environmental and social outcomes in urban areas The Urban Environment – Royal Commission on Environmental Pollution March 2007
Reccommendations that Directly Influence Health • Reduce hot spots of air pollution in urban settings.
Schematic representation of population exposure to air pollution and potential Impacts of air quality management strategies
Schematic representation of population exposure to air pollution and potential Impacts of air quality management strategies
Reccommendations that Directly Influence Health • Reduce hot spots of air pollution in urban settings. • Promotion of overall air pollution reduction for the whole population (Gap Closure).
Schematic representation of population exposure to air pollution and potential Impacts of air quality management strategies
Air pollution Mental illness Obesity Unravelling Environmental Factors Shaping Health
Exercise Space and a sense of place Diet What we must aspire to
Reccommendations that Directly Influence Health • Reduce hot spots of air pollution in urban settings. • Promotion of overall air pollution reduction for the whole population (Gap Closure). • Develop a statutory framework for Health Impact Assessments as a component of Environment Impact Assessment in urban planning.