Download
1 / 19
220 likes | 412 Vues
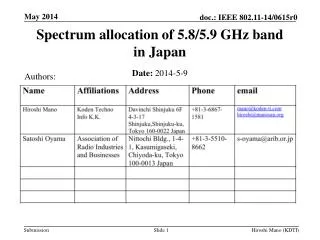
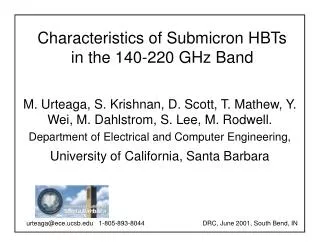
Characteristics of Submicron HBTs in the 140-220 GHz Band. M. Urteaga, S. Krishnan, D. Scott, T. Mathew, Y. Wei, M. Dahlstrom, S. Lee, M. Rodwell. Department of Electrical and Computer Engineering, University of California, Santa Barbara.

E N D
Characteristics of Submicron HBTs in the 140-220 GHz Band M. Urteaga, S. Krishnan, D. Scott, T. Mathew, Y. Wei, M. Dahlstrom, S. Lee, M. Rodwell. Department of Electrical and Computer Engineering, University of California, Santa Barbara urteaga@ece.ucsb.edu 1-805-893-8044 DRC, June 2001, South Bend, IN
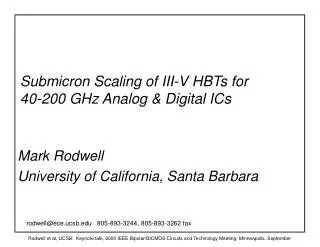
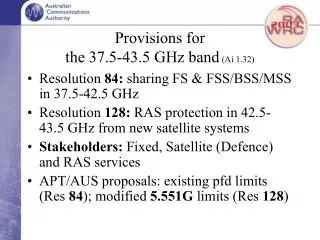
15 10 5 0 Ultra-high fmax Transferred-Substrate HBTs • Substrate transfer provides access to both sides of device epitaxy • Permits simultaneous scaling of emitter and collector widths • Maximum frequency of oscillation • Sub-micron scaling of emitter and collector widths has resulted in record values of extrapolatedfmax • Extrapolation begins where measurements end • New 140-220 GHz Vector Network Analyzer (VNA) extends device measurement range 30 Mason's 3000 Å collector 400 Å base with 52 meV grading AlInAs / GaInAs / GaInAs HBT gain, U 25 20 MSG Gains, dB H f = 1.1 THz ?? 21 max Emitter, 0.4 x 6 mm2 f = 204 GHz t Collector, 0.7 x 6 mm2 I = 6 mA, V = 1.2 V c ce 10 100 1000 Frequency, GHz
High Frequency Device Characterization Motivation Characterize transistors to highest measurable frequency Develop an accurate measurement methodology Measure Transistor Power Gains Results Measured submicron transistors DC-45 GHz, 75-110 GHz, 140-220 GHz bands Observed singularity in Unilateral Power Gain Submicron HBTs have very high power gain, but fmax can’t be determined
InGaAs 1E19 Si 1000 Å Grade 1E19 Si 200 Å InAlAs 1E19 Si 700 Å InAlAs 8E17 Si 500 Å Grade 8E17 Si 233 Å Grade 2E18 Be 67 Å InGaAs 4E19 Be 400 Å InGaAs 1E16 Si 400 Å InGaAs 1E18 Si 50 Å InGaAs 1E16 Si 2550 Å InAlAs UID 2500 Å S.I. InP InGaAs/InAlAs HBT Material System Layer Structure Band diagram at Vbe = 0.7 V, Vce = 0.9 V 2kT base bandgap grading 400 Å base, 4* 1019/cm33000 Å collector
Transferred-Substrate Process Flow • Emitter metal • Emitter etch • Self-aligned base • Mesa isolation • Polyimide planarization • Interconnect metal • Silicon nitride insulation • Benzocyclobutene, etch vias • Electroplate gold • Bond to carrier wafer with solder • Remove InP substrate • Collector metal • Collector recess etch
Ultra-high fmax Submicron HBTs • Electron beam lithography used to define submicron emitters and collectors • Minimum feature sizes • 0.2 m emitter stripe widths • 0.3 m collector stripe widths • Improved collector-to-emitter alignment using local alignment marks • Aggressive scaling of transistor dimensions predicts progressive improvement of fmax • As we scale HBT to <0.4 m, fmax keeps increasing,measurements become very difficult 0.3 m Emitter before polyimide planarization Submicron Collector Stripes(typical: 0.7 um collector)
How do we measure fmax? Maximum Available Gain Simultaneously match input and output of device K = Rollet stability factor Transistor must be unconditionally stable or MAG does not exist Maximum Stable Gain Stabilize transistor and simultaneously match input and output of device Approximate value for hybrid- model To first order, MSG does not depend on f or Rbb For Hybrid- model, MSG rolls off at 10 dB/decade, MAG has no fixed slopeCANNOT be used to accurately extrapolate fmax
Unilateral Power Gain Mason’s Unilateral Power Gain Use lossless reactive feedback to cancel device feedback and stablize the device, then match input/output. U is not changed by pad reactances For Hybrid- model, U rolls off at 20 dB/decadeALL Power Gains must be unity at fmax
Negative Unilateral Power Gain ??? Can U be Negative? YES, if denominator is negative This may occur for device with a negative output conductance (G22) or some positive feedback (G12) What Does Negative U Mean? Device with negative U will have infinite Unilateral Power Gain with the addition of a proper source or load impedance AFTER Unilateralization • Network would have negative output resistance • Can support one-port oscillation • Can provide infinite two-port power gain Select GL such that denominator is zero: Simple Hybrid- HBT model will NOT show negative U
230 mm 230 mm Accurate Transistor MeasurementsAre Not Easy • Submicron HBTs have very low Ccb (< 5 fF) • Characterization requires accurate measure of very small S12 • Standard 12-term VNA calibrations do not correct S12 background error due to probe-to-probe coupling • Solution • Embed transistors in sufficient length of transmission line to reduce coupling • Place calibration reference planes at transistor terminals • Line-Reflect-Line Calibration • Standards easily realized on-wafer • Does not require accurate characterization of reflect standards • Characteristics of Line Standards are well controlled in transferred-substrate microstrip wiring environment Transistor Embedded in LRL Test Structure Corrupted 75-110 GHz measurements due to excessive probe-to-probe coupling
140-220 GHz On-Wafer Network Analysis • HP8510C VNA used with Oleson Microwave Lab mmwave Extenders • Extenders connected to GGB Industries coplanar wafer probes via short length of WR-5 waveguide • Internal bias Tee’s in probes for biasing active devices • Full-two port T/R measurement capability • 75-110 GHz measurement set-up uses same waveguide-to-probe configuration with internal HP test set UCSB 140-220 GHz VNA Measurement Set-up
Can we trust the calibration ? 75-110 GHz calibration looks Great 140-220 GHz calibration looks OK S11 of open About 0.1 dB / 3o error S11 of through About –40 dB S11 of short S11 of through S11 of open Probe-Probe coupling is better than –45 dB S21 of through line is off by less than 0.05 dB dB
0.3 m Emitter / 0.7 m Collector HBTs: Negative U RF Gains Negative U Emitter: 0.3 x 18 m2, Collector: 0.7 x 18.6 m2Ic = 5 mA, Vce = 1.1 V Gains are high at 200 GHz but fmax can’t be determined
0.3 m Emitter / 0.7 m Collector HBTs: Negative Output Conductance Real (Y11) Real (Y21) Emitter: 0.3 x 18 m2, Collector: 0.7 x 18.6 m2Ic = 5 mA, Vce = 1.1 V Real (Y12) Real (Y22) Negative Y22
0.4 m Emitter / 1.0 m Collector HBTs RF Gains Emitter: 0.4 x 6 m2, Collector: 1.0 x 6.6 m2Ic = 3 mA, Vce = 1.1 V
0.4 m Emitter / 1.0 m Collector HBTs Real (Y11) Real (Y21) Emitter: 0.4 x 6 m2Collector: 1.0 x 6.6 m2Ic = 3 mA, Vce = 1.1 V Real (Y12) Real (Y22) Negative Y22
Less Scaled Devices show expected Power Gain Rolloff RF Gains Emitter: 0.5 x 8.0 m2, Collector: 1.2 x 8.6 m2Ic = 4 mA, Vce = 1.8 V
Conclusions Submicron HBTs have Extremely Low Parasitics Extremely High Power Gains High fmax HBTs are hard to measure Probe-to-Probe coupling can cause errors in S21 Highly scaled transistors show a negative unilateral power gain coinciding with a negative output conductance Cannot extrapolate fmaxfrom measurements of U but… Device has ~ 8 dB MAG at 200 GHz Single-stage amplifiers with 6.3 dB gain at 175 GHz have been fabricated (To be presented 2001 GaAs IC Conference Baltimore, MD) Possible sources of Negative Output Conductance Dynamics of capacitance cancellation Dynamics of base-collector avalanche breakdown Measurement Errors (We hope we’ve convinced you otherwise)
Acknowledgements This work was supported by the ONR under grant N0014-99-1-0041 And the AFOSR under grant F49620-99-1-0079