Download
1 / 32
320 likes | 337 Vues
Detailed overview of RAINS model for emission projections, including principles, methods, examples, and cost-effectiveness integration. Focus on multi-pollutant/multi-effect analysis for policy scenarios.

E N D
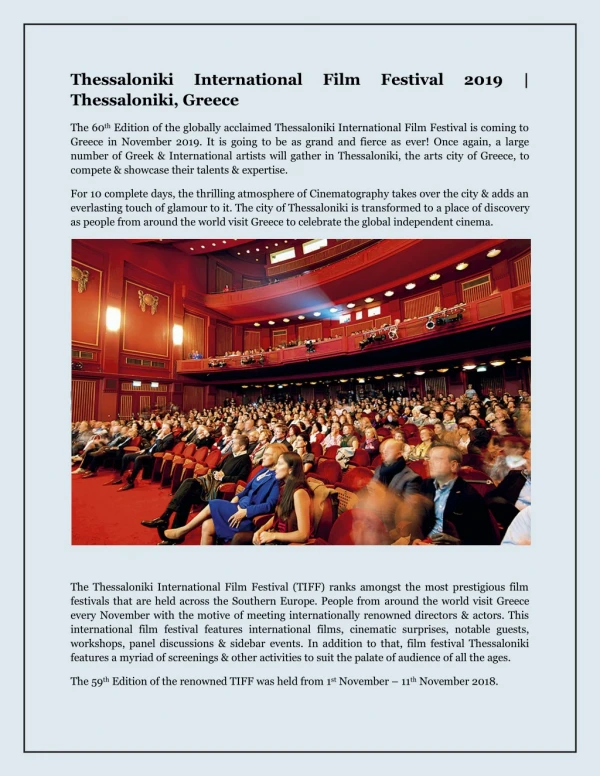
RAINS overviewTFIEP Workshop on Emission ProjectionsThessaloniki, Greece, 30-31 October, 2006 Zbigniew Klimont EMEP Centre for Integrated Assessment Modelling (CIAM)
Content • Principles and type of analysis • Method and structure of emission calculation • Data flow • Calibration • Projection data • Examples of projections and arising issues • More information? • No conclusions
Cost-effectiveness needs integration • Economic/energy development (projections) • State of emission controls, available technologies, costs • Atmospheric processes • Environmental sensitivities
Health & environmental impact indicators The RAINS model:Scenario analysis mode Energy/agriculture projections Driving forces Emission control options Emissions Costs Atmospheric dispersion
IIASA’s RAINScomputer model PM SO2 NH3 NOx VOC Policy targets Multi-pollutant/multi-effect analysisfor identifying cost-effective policy scenarios Health Eutrophication Acidification Ozone
The cost-effectiveness approach Models help to separate policy and technical issues:
Emission sources (1) • Several sectors: • energy • industrial production • transport • solvent use • agriculture • Activities • fuels (17) • processes (~70) • other (e.g., livestock farming, paint use)
Emission sources (2)Criteria for aggregation RAINS applies five criteria: • Importance of source (>0.5 percent in a country) • Possibility for using uniform activity rates and emission factors • Possibility of establishing plausible forecasts of future activity levels • Availability and applicability of “similar” control technologies • Availability of relevant data In spite all that effort….about 1500 emission categories included.
Emission sources (3) Level of detail (1): • Energy: • Power plants (by fuel and furnace type) • Industry (by fuel and furnace type) • residential combustion (by fuel and installation type) • Industrial processes: • NMVOC module (over 20 sectors) • PM module (over 40 sectors) • Transport: • Road (two-wheelers, cars, trucks; by fuel and engine type) • Off-road (several categories; by fuel) • Non-exhaust (brake, tyre, and road wear and evaporative) • Shipping (inland shipping, coastal zone, international)
Emission sources (4) Level of detail (2): • Agriculture: • Animal categories (by housing type) • N-Fertilizer application (urea and other fertilizers) • Industry • Transport • Other • Other: • NMVOC module (e.g., evaporative losses from fuel distribution, paint use, waste burning, etc.) • PM module (agriculture, waste burning, storage and distribution of fuels and industrial products, etc.)
Solvent use: Dry cleaning and degreasing Decorative paints Industrial paint application Vehicle manufacturing and repair Printing Manufacture of paints, inks and glue Preservation of wood Chemical industry Tyre production Pharmaceutical industry Domestic use of solvents Other Oil production and use: Off- and on- shore exploration Refineries Storage of crude and products Distribution of products (e.g., gasoline stations) Mobile: Evaporative emissions from gasoline engines Exhaust emissions from road and off-road vehicles Emission sources (5)EXAMPLE: VOC processes/sources
Method - Calculating emissions where: i,j,k,m,y Country, sector, fuel, abatement technology, pollutant Ei,yEmissions in country i and pollutant (species) y A Activity in a given sector ef “Raw gas” emission factor effmReduction efficiency of the abatement option m XmImplementation rate of the considered abatement measure m
Method - Information on the level of activity • Historical (1990,1995,2000) – statistics, communication with national experts, own assessments • Forecasts (until 2030) – energy models, agricultural models, countries’ submissions
Method – emission factors • “Unabated” emission factors for anthropogenic sources only • Country/region specific factors taken into account wherever possible, i.e.: • For SO2: fuel characteristics • For PM: fuel and installation characteristics • For NH3: N-excretion and volatilization, production efficiency, housing period • For NMVOC: climatic conditions, volatility of fuels, solvent content of products
Method – abatement techniques • Economic and technical information for “technical” measures • For most techniques efficiency assessed from literature and communication with experts, however, country/region specific factors taken into account when necessary, i.e.: • For NH3: geophysical conditions, feeding strategies • For NMVOC: sector “composition”, solvent content of products • Introduction of “applicability” parameter, i.e., maximum technically feasible application rate of control option • Actual and projected penetration rate of control technology
Data flow Expert Groups Industrial Experts Emissions EMEP (Verification) National Experts RAINS model Parameters, e.g, abatement efficiencies Activity data, emissions, abatement penetration
Changes in national emission inventories for 2000 - NEC vs. earlier assessment (1)
Changes in national emission inventories for 2000 - NEC vs. earlier assessment (2)
National assessments vs. RAINS estimate for 2000 SO2 NOx NH3 NMVOC
PM emissions – national assessment vs. RAINS estimate for 2000
Input data for projections Driving forces • National information on projected energy (21), agricultural (18) and other activities • European models: • Energy and macroeconomic assumptions - PRIMES, • Agriculture - CAPRI, FAO, EFMA, • Transport - TREMOVE • Other sources, e.g., industry (solvents), CEPMEIP Parameters • Penetration of abatement techniques • Changes in efficiency of production • Applicability of abatement
Problems and uncertainties(SOx, NOx, PM) • Transport – Veh-km and vehicle numbers often inconsistent with fuel consumption. Projections of vehicle numbers available only for a few countries • Differences in reporting transport emissions – fuel sold vs. fuel used. For NEC fuel sold was taken • PM estimates – some countries don’t report PM2.5 and PM10; often not all sources included • Poor information on size an chemical speciation for several sources • Larger uncertainty for un- or poorly regulated sources, i.e., industrial processes, off-road, domestic • Availability of data on biomass use • ‘Real life’ reduction efficiencies, e.g., NOx-HDT, PM-DPM
Problems and uncertainties(NH3) • For few countries issue of base year statistical data; inconsistencies between national and international data • Poor information on housing systems in place and their future evolution • Contradictory information on how existing legislation is or will be implemented • Emissions from non-agricultural sources not always reported • For a number of countries better information on current practices could lead to significant improvements, i.e., development of national emission factors
Changes in ammonia emissions for different activity projections
Comparison of agricultural activity projectionsExample for Dairy cows
Changes in ammonia emissions for different interpretation of law Implementation of legislation – interpretation of IPPC Directive
Changes in ammonia emissions for different interpretation of law Implementation of legislation – interpretation of IPPC Directive
Problems and uncertainties(NMVOC) • Unsatisfactory resolution of emission reporting format does not allow for verification of emissions from solvent use • Evaporative emissions from cars, residential combustion and solvent use contribute most to the uncertainty of 2000 estimates; the latter two retain their importance for 2020 calculations • Better information on combustion technology used in residential sector essential for future work • National projections for emissions from solvent use remain an exception; industry provided their perspective for a number of sectors and MS • Emissions from open biomass burning often not included • Better collaboration between industrial associations and national emission experts could lead to significant improvements
NMVOC emission trends (example for coating sector)national vs. industrial perspective
More information The background information available from: • Home of RAINS:http://www.iiasa.ac.at/rains/ • The RainsWeb on line model:http://www.iiasa.ac.at/web-apps/apd/RainsWeb • The RAINS documentation:http://www.iiasa.ac.at/rains/databases.html • The RAINS review:http://www.iiasa.ac.at/rains/review