Download
1 / 24
240 likes | 372 Vues
U.S. Geological Survey Monitoring and Assessment Programs. Aquatic invasive species Nutrient enrichment Beach Health Contaminants – in Sediments, Fish and Drinking Water Nuisance algal blooms Habitat degradation Loss and Alteration of Coastal Wetlands Fisheries and food web changes.

E N D
U.S. Geological Survey Monitoring and Assessment Programs
Aquatic invasive species Nutrient enrichment Beach Health Contaminants – in Sediments, Fish and Drinking Water Nuisance algal blooms Habitat degradation Loss and Alteration of Coastal Wetlands Fisheries and food web changes Management Issuesin the Lake Michigan Basin
Current Monitoring Efforts • Need to identify historical and current monitoring for Cyanobacteria and toxins and related factors • USGS is developing a mapper tool and database to pull together as much Great Lakes monitoring data as possible.
What? • nutrient monitoring, • toxics monitoring, • virus sampling
When? • Data calibration • Calibration to monthly • Base flow measurements • Stormflow (6 storms/yr.) • Fixed-interval samples • 60 environmental samples per site
How? • real-time sensors • Surrogates for: • Suspended sediment, • Nutrients, • Chloride
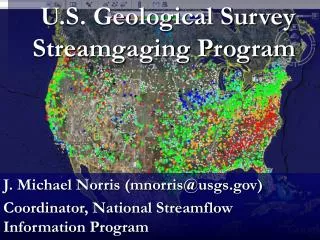
30National Monitoring Networksites with real-time flow and water-quality information
All real-time monitoring available at: http://waterwatch.usgs.gov/wqwatch/
Real-time water quality monitors Multi-parameter (YSI) Sonde • Why Continuous QW Monitoring? • Improves our understanding of hydrology and water quality • Continuous data (every 15 minutes) --captures seasonal, diurnal, and event-driven fluctuations • Reduces Time and Costs associated with manual sampling. • Few discrete samples (20 per year) used to develop QW interpretations. • Estimating non-monitored constituents involves regressions to discharge. • Use water-quality data to predict water-quality data!
Surrogate load estimates • Using monitoring sensors, collected samples to provide estimates of concentrations and loads of other constituents • time-series-based estimator to provide on-line (filter) and off-line (smoother) estimates of concentrations • For: sediment, chloride, and nutrients including ammonia plus organic nitrogen and total phosphorus • estimates will: • use past and current information from discrete measurements • utilize continuous measurements of surrogate water-quality constituents • be computed using data before and after the time of estimation
Determine Baseline and Sources of Toxic Contaminant Loadings • Automated sampling for viruses • Two to three basins up stream of the selected NMN sites • monitored for human and animal viruses, wastewater indicators, • veterinary antibiotics, protozoa, and bacterial pathogens • Monitor at 8 Nutrient site potential watersheds: • Manitowac, • Milwaukee, • Fox, • Clinton, • Rougue, • Maumee • Portage • Plus 1 other in Michigan • Monitor for viruses and pathogens using auto virus sampler, monthly and 6 storms
Determine Baseline and Sources of Toxic Contaminant Loadings • Organochlorine pesticides, PCB’s and PBDE’s • (30 analytes plus Total PCB’s and 5 PCB Congeners) • Polycyclic Aromatic Hydrocarbons • (34 analytes) • Wastewater Indicator Chemicals • (44 analytes) • Pharmaceuticals • (44 analytes)
Sediment traps at 15 AOC sites in the Great Lakes • Sediment traps at 15 AOC sites in the Great Lakes • Sediment traps at 15 AOC sites in the Great Lakes • Determine Baseline and Sources of Toxic Contaminant Loadings • Sediment traps at 15 AOC sites in the Great Lakes Sediment traps at 15 AOC (Area of Concern) sites in the Great Lakes • Sample for: • PAH’sand Total PCB’s • Alkylated PAH’s, • Pharmaceuticals • Sampling will be upstream of AOC’s and when applicable downstream of AOC’s • determine if upstream is a continuing loading source for the AOC. deployed at all 15 AOC sites in fall of 2010
Flood Inundation Mapping High-water marks USGS Real-time streamgage data FIMI http://las.depaul.edu/geography/images/Misc_Images/gis.jpg National Weather Service flood forecasts
USGS FIMI Focus Areas • Major flood documentation studies using high-water marks • Static inundation map libraries at gages/flood forecast points • Real-time, dynamic applications for the future
Annual Fish Stock Assessments • Scientists assess results of trawl • Helps determine prey/predator balance • Long-term: >70 yrs of USGS data
Zebra Mussels • One of the most visible invasive species in the Great Lakes • These filter feeders have cleaned up lake water, allowing greater light penetration
Algae in the Great Lakes • Nuisance algae has been increasing • Related to dreissenid mussels – light penetration in water • USGS research on Cladophora and beach closure issues
Beach Health • Beaches are closed when too many pathogens are detected in water • Need to track sources and make earlier and better predictions of closing • USGS beach research on models and methods for better predictions
Wetlands • Wetlands in Great Lakes are critical to restoration and protection • USGS research in many places such as Metzger Marsh on Lake Erie • Important for lake level regulation
Sediment traps at 15 AOC sites in the Great Lakes • Sediment traps at 15 AOC sites in the Great Lakes • Sediment traps at 15 AOC sites in the Great Lakes Thank You • Sediment traps at 15 AOC sites in the Great Lakes