Faculty Financial Advisory Committee: FY2005 Annual Report
280 likes | 365 Vues
This PowerPoint set reviews faculty and administrative salaries with statistical data, committee recommendations, and budget comparisons. It outlines the met objectives, data collection methods, and budget increase details.

Faculty Financial Advisory Committee: FY2005 Annual Report
E N D
Presentation Transcript
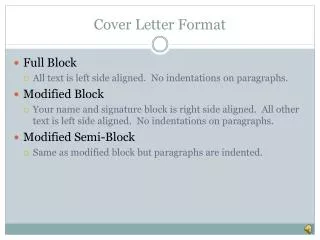
Cover Letter This set of power point slides constitutes the annual report for the Faculty Financial Advisory Committee for FY 2005. It has been updated with a limited amount of additional FY 2005 faculty and administrative salary comparisons, and a slide has been added that present the statistical data on the variance of faculty salaries on this campus delineated by department and rank. Chancellor White has or is in the process of implementing all the recommendations brought forth by the committee. The Faculty Chair, the Chair of the Faculty Senate and the Chair of the Faculty Financial Advisory Committee were all included in the FY 2006 budget hearings of the academic colleges and major administrative budget units. This process was informative and well received. A process is being developed to review and audit administrative processes as recommended by the committee. Vice Chancellor Pederson has provided additional explanation of accounting procedural changes in the budget books between FY 2000 and FY 2005 that brings into question the accuracy of the conclusion in slide 26 with regard to administrator’s budget increases compared to academic colleges. These budget comparisons will be examined in greater detail by the committee next fiscal year.
Faculty Senate Financial Advisory Committee Report Annual Report July 20, 2005
Committee Members • Buddy Babcock Ro DiBrezzo • Judy Brittenum Luke Howard • Uche Ewelukwa Phyllis Miller • Tim Kruse Robert Brady
Faculty Handbook Charge • Standing committee composed of a representative from each college • Solicit ideas from the faculty and communicate to campus administration • Cost Saving • Budget Priorities • Nominated by the Committee on Committees and appointed by the Chair of the Campus Faculty • Five year terms
Special Senate Chair Charge • Benchmark Adm. & Faculty Salaries against National/Regional Groups • Compare Adm. & Faculty Raises at U of A • Analyze, Report, & Recommend • Five Year Period from FY 2000 – FY 2005
Mode of Operation • Met monthly for approximately 1-1/2 hrs. • Two special called meetings • Various tasks assigned between meeting dates • Collected data from: • Institutional Research Office • Annual Budget Documents • Various benchmark websites • A few personal interviews • Human Resources Office
Data Groups • Alabama Study - Administrators • Southern Universities Group (31 Public Doctoral Granting Univ. from Ariz. to Del. • AAUP Study – Faculty • Oklahoma State Study • Delaware Study
Definitions • No. of faculty is a head count including Instructors and Lecturers as defined by the AAUP study (800) • Administrators were limited to the following groups: • Cat. 1 President, Provost, Chancellor & Vice Chancellors (7) • Cat. 2 Associate Vice Chancellors (10) • Cat. 3 Deans (10) • Others IncludedAdministrative Directors/Selected Equivalent Positions (34)
National Comparison • It’s Lucrative at the Top – Chronicle of Higher Education by Basinger & Henderson, Nov 19, 2004 • Top 20 Paid Public Univ. Leaders Salaries range from $762,000 down to $477,650 • U of A Salaries do not even begin to be competitive with these salary ranges
BU 5 YR Budget Increases • CHAN Business Unit • Salaries $374,452 to 569,775 52% • Total All CC $585,635 to 855,382 46% • VCAC – Academic Affairs • Salaries $277,510 to 472,170 70% • Total All CC $1,510,231 to 2,031,097 34% • VCAD - Advancement • Salaries $254,907 to 338,168 33% • Total All CC $304,594 to 394,143 29%
BU 5 YR Budget Increases • VCFA – Financial Affairs • Salaries $336,582 to 398,533 18% • Total All CC $478,274 to 770,747 61% • UDEV • Salaries $1,077,285 to 2,721,668 153% • Total All CC $ 1,402,993 to 3,294,550 134% • GNSS • Salaries $571,207 to 592,260 4% • Total All CC $ 742,847 to 1,407,841 90% • Salaries 1,874,899 to 3,194,025 70% • Total Hard Budget 2,2821,394 to 3,434,791 22%
Academic Colleges 5 YR Hard Budget Increases • AGRI (1000’S $) • Total $ 4,662 to 5,646 21.1% • ARCH • Total $2,418 to 2,836 17.3% • ARSC • Total $30,761 to 34,911 13.5% • BADM • Total $10,239 to 13,716 34.0%
BU 5 YR Budget Increases • CTED (1000’S $) • Total $ 3,035 to 3,221 6.0% • EDUC • Total $8,655 to 10,170 17.5% • ENGR • Total $10,138 to 13,315 31.3% • LAW • Total $6,122 to 8,532 39.4% • GRAD • Total $1,376 to 2,754 100%
Additional 5 Year Trends • Student enrollment has increased 13.4 % • Total payroll salaries increased 19 % • Six year graduation rates have risen to 52.9 % (1998 Cohort) • Entering Students HSGPA has risen from 3.44 to 3.59 • Research Dollars have risen 30% to $91MM
5 Year Conclusions(1) • Faculty numbers have remained constant • Total employees has only slightly increased(2%) • The number of staff including administrators has increased significantly(40%) • Both faculty & administrator’s salaries averages are below the SUG averages, but not egregiously so. • At this campus, administrator’s absolute and % salary raises have been disproportionately large over the past 5 years compared to that of the faculty • Average faculty salary by department /rank exhibits too great of a variance and should be investigated further next year.
Conclusions (2) • Tuition & fee revenue has increased 84% and the overall campus budget increased 44% while the Instruction budget category increased only 20%. • Administrator’s budget unit % increases are high compared to academic college budget unit increases. • Scholarship expenditures have increased 89% to $31 MM.
Recommendations (1) • Vice Chancellor for Finance and Administration, in concert with FAC, report to the faculty senate each spring semester on trends in pertinent budget categories • The Chair of the Financial Advisory Committee, the Faculty Chair and the Chair of the Faculty Senate be included in the yearly budget planning process
Recommendations(2) • Performance criteria be established and outcome assessments made of all administrative BU’s. • Process reviews conducted on all administrative BU’s activities with a goal of reducing overhead costs • Six sigma procedures be investigated as a means to achieving stated goals and objectives