Download
1 / 18
180 likes | 391 Vues
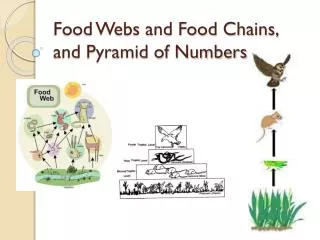
Food Webs and Food Chains, and Pyramid of Numbers. Food Chain- linear depiction of energy flow between organisms, with each organism feeding on and deriving energy from the preceding organism.

E N D
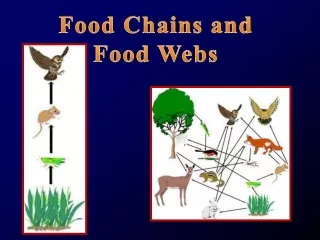
Food Chain- linear depiction of energy flow between organisms, with each organism feeding on and deriving energy from the preceding organism.
Food web- A complex model of interconnected food chains in which there are multiple links between species. *Chain length refers to the number of links between trophic levels. Most tend to be short, usually less than 5.
Comparing efficiency of energy transfer in different food webs: Production efficiency: % of energy assimilated by an organism that becomes incorporated into new biomass. • Invertebrates: ↑ efficiency (10-40%) • Vertebrates: ↓ efficiency (1%-2% in birds/mammals) devote more energy to sustaining metabolism. • Higher in younger animals that are rapidly accruing biomass.
Trophic level transfer energy- amount of energy at one trophic level that is acquired by the level below. • Production at trophic level n x 100 Production at trophic level n-1
Practice Problem If there were 14 g/m2 of zooplankton in a lake (trophic level n) and 100 g/m2 of phytoplankton production (trophic level n-1), the trophic level efficiency would be _____%. ANSWER: 14%
Low Trophic-level Transfer Efficiencies • Averages around 10%, although there is much variation (marine animals can exceed 30%). • Critical Thinking: What are two possible reasons for low trophic-level transfer efficiency? 1. Many organisms cannot digest all their prey. 2. Much of the energy assimilated is used in maintenance.
Ecological Pyramids • Pyramid of Numbers- number of individuals decreases at each trophic level, with the largest number at the base.
Inverted Pyramid of Numbers • greater number of individuals at the top. • What would be an example of a food chain that has this type of pyramid?
An oak tree, one single producer, supports hundred of herbivorous beetles, caterpillars, and other primary consumers, which in turn may support thousands of predators and parasites.
Pyramid of Biomass • Best way to reconcile inverted pyramid • The oak tree weighs 30,000 kg, all the herbivores on the tree total 5 kg, and the predators about 1 kg. (Upright pyramid). 1 kg 5 kg 30, 000 kg
Pyramids of Production • Used in rare cases when there is an inverted pyramid of biomass • (In a marine systems, biomass of phytoplankton supports a higher biomass of zooplankton, which in turn is eaten by a higher biomass of carnivorous fish) .0016 g/m2/day .15 g/m2/day .4 g/m2/day
Biomagnification • Tendency of certain chemical elements to accumulate or build up within food chains. • Toxic burden of a large number of organisms at a lower trophic level is accumulated and concentrated by a predator at a higher trophic level. • Passage of DDT in food chains provides a startling example.
DDT • Some chemical compounds are very unstable and degrade rapidly under most conditions, thus their concentrations decline quickly after release. • Others are more persistent. DDT • Stability can cause problems as toxic effects may be stored for long period of time and spread to unintended victims.
Critical Thinking Can you suggest any chemical or physical properties of DDT that influence the nature of its ecological impact? • DDT is not easily degraded to other, less toxic chemicals (persistence of 10 years) • DDT has a low solubility in water and high solubility in fats. Most lipids are present in living tissue, therefore DDT tends to concentrate in biological tissues.
Historical Use of DDT • Initially used during and after WW II, in particular to control mosquito-borne malaria and in agriculture. • In 1970, 175 million kg manufactured! • Led to the substantial decrease in gull population and was banned by the U.S. in the 1970s.
http://www.on.ec.gc.ca/community/classroom/millennium/m3-science-assign-e.htmlhttp://www.on.ec.gc.ca/community/classroom/millennium/m3-science-assign-e.html