Download
1 / 8
80 likes | 156 Vues
Explore the dangers of immediate use of model-based methods in the chronic bronchitis study, focusing on logistic regression, odds ratios, residuals, goodness of fit, and alternative model considerations. Dive into interpreting data units and interactions. Rethink the analysis for deeper insights.

E N D
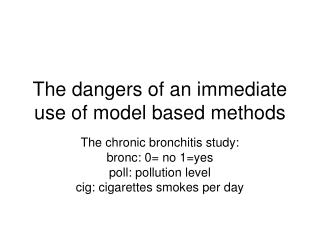
The dangers of an immediate use of model based methods The chronic bronchitis study: bronc: 0= no 1=yes poll: pollution level cig: cigarettes smokes per day
The original analysis: . logistic bronc cig poll • Logistic regression Number of obs = 212 • LR chi2(2) = 47.56 • Prob > chi2 = 0.0000 • Log likelihood = -87.107226 Pseudo R2 = 0.2145 • ------------------------------------------------------------------------------ • bronc | Odds Ratio Std. Err. z P>|z| [95% Conf. Interval] • -------------+---------------------------------------------------------------- • cig | 1.235761 .0471199 5.55 0.000 1.146774 1.331653 • poll | 1.140834 .0558477 2.69 0.007 1.036461 1.255716 • ------------------------------------------------------------------------------ • Looks good? They focussed on the p-values but… • What of the units of poll and cig? • Interpretation? Other models considered? • Goodness of fit… better look at the residuals
Any sign of trouble? • . predict res,rstandard • . list cig poll if res>=2 | res<=-2 • +--------------+ • | cig poll | • |--------------| • 42. | 0 65.1 | • 53. | 16.45 60.6 | • 55. | 0 61.7 | • 72. | 0 61.8 | • 98. | 3.7 57.2 | • |--------------| • 124. | 0 55.9 | • 129. | 0 58.9 | • 146. | 0 55.9 | • 163. | 24.9 58 | • 169. | 7.5 53.7 | • |--------------| • 175. | 5 55.8 | • 192. | 4.5 58 | • +--------------+
…make the model more complicated? • . gen cig2=cig*cig • . logit bronc cig cig2 poll • Logit estimates Number of obs = 212 • LR chi2(3) = 57.70 • Prob > chi2 = 0.0000 • Log likelihood = -82.039897 Pseudo R2 = 0.2602 • ------------------------------------------------------------------------------ • bronc | Coef. Std. Err. z P>|z| [95% Conf. Interval] • -------------+---------------------------------------------------------------- • cig | .4409934 .082988 5.31 0.000 .2783399 .603647 • cig2 | -.0130287 .0037644 -3.46 0.001 -.0204067 -.0056506 • poll | .1392156 .0503827 2.76 0.006 .0404674 .2379639 • _cons | -11.03608 3.062191 -3.60 0.000 -17.03786 -5.034292 • ------------------------------------------------------------------------------ • Where is the maximum log of odds of bronc? • . display 0.4409934/(2*0.0130287) • 16.923922
…ack! Try cubic? Interactions?….or better look at this data • . table fcig fpol bronc • ---------------------------------------------------------------- • | Bronchitis and Pollution Group • Smoking | ------------------------ no ------------------------ • Group | <55 55-57.5 57.5-60 60-62.5 62.5-65 >65 • ----------+----------------------------------------------------- • zero | 6 10 12 9 7 3 • 0-1 | 17 11 8 3 3 1 • 1-3 | 9 8 8 4 4 2 • 3-5 | 6 4 2 1 1 • 5-8 | 2 2 2 3 2 • >8 | 3 6 2 4 1 • ---------------------------------------------------------------- • ---------------------------------------------------------------- • | Bronchitis and Pollution Group • Smoking | ------------------------ yes ----------------------- • Group | <55 55-57.5 57.5-60 60-62.5 62.5-65 >65 • ----------+----------------------------------------------------- • zero | 1 2 2 2 • 0-1 | • 1-3 | • 3-5 | 2 2 1 2 • 5-8 | 1 1 3 2 2 • >8 | 3 5 5 5 3 2 • ----------------------------------------------------------------
Now what? Completely rethink this mess… one try? • . xi: logistic bronc i.fcig poll • i.fcig _Ifcig_1-6 (naturally coded; _Ifcig_1 omitted) • note: _Ifcig_2 != 0 predicts failure perfectly • _Ifcig_2 dropped and 43 obs not used • note: _Ifcig_3 != 0 predicts failure perfectly • _Ifcig_3 dropped and 35 obs not used • Logistic regression Number of obs = 134 • LR chi2(4) = 28.75 • Prob > chi2 = 0.0000 • Log likelihood = -71.811409 Pseudo R2 = 0.1668 • ------------------------------------------------------------------------------ • bronc | Odds Ratio Std. Err. z P>|z| [95% Conf. Interval] • -------------+---------------------------------------------------------------- • _Ifcig_4 | 4.403389 2.820127 2.31 0.021 1.254988 15.45021 • _Ifcig_5 | 4.931114 3.065457 2.57 0.010 1.458111 16.6763 • _Ifcig_6 | 11.7099 6.352792 4.54 0.000 4.043558 33.91115 • poll | 1.129489 .0625894 2.20 0.028 1.013243 1.259072 • ------------------------------------------------------------------------------
…but look at the *note* • . lstat • Logistic model for bronc • -------- True -------- • Classified | D ~D | Total • -----------+--------------------------+----------- • + | 22 18 | 40 • - | 24 70 | 94 • -----------+--------------------------+----------- • Total | 46 88 | 134 • Classified + if predicted Pr(D) >= .5 • True D defined as bronc != 0 • -------------------------------------------------- • Sensitivity Pr( +| D) 47.83% • Specificity Pr( -|~D) 79.55% • Positive predictive value Pr( D| +) 55.00% • Negative predictive value Pr(~D| -) 74.47% • -------------------------------------------------- • False + rate for true ~D Pr( +|~D) 20.45% • False - rate for true D Pr( -| D) 52.17% • False + rate for classified + Pr(~D| +) 45.00% • False - rate for classified - Pr( D| -) 25.53% • -------------------------------------------------- • Correctly classified 68.66% • --------------------------------------------------
…next step? ….maybe a classical analysis is in order… Are there other variables measured? reassess the entire project?