QUANTITATIVE PALAEOECOLOGY
QUANTITATIVE PALAEOECOLOGY. Lecture 4. Quantitative Environmental Reconstructions BIO-351. CONTENTS. Introduction Indicator-species approach Assemblage approach Mutual Climate Range method Probability density functions


QUANTITATIVE PALAEOECOLOGY
E N D
Presentation Transcript
QUANTITATIVE PALAEOECOLOGY Lecture 4. Quantitative Environmental Reconstructions BIO-351
CONTENTS Introduction Indicator-species approach Assemblage approach Mutual Climate Range method Probability density functions Proxy dataGeneral theoryAssumptions of transfer functionsLinear-based methods Inverse linear regression Inverse multiple linear regression Principal components analysis regression Segmented inverse regression Partial least squares Requirements – biological and statistical
CONTENTS (2) Non-linear (unimodal) based methods Maximum likelihood regression and calibration Weighted averaging regression and calibration Error estimation Training set assessment Reconstruction evaluation Reconstruction validation Examples of weighted-averaging reconstructions Weighted-averaging – assessment Correspondence analysis regression Weighted-averaging partial least-squares (WA-PLS) Pollen-climate response surfaces Analogue-based approaches Consensus reconstructions and smoothers Use of artificial simulated data sets No analogue problem Multiple analogue problem Multi-proxy approaches Synthesis
INTRODUCTION ‘TRANSFER FUNCTION’ or ‘BIOTIC INDEX’ CALIBRATION or BIOINDICATION INDICATOR-SPECIES APPROACH = SINGLE SPECIES BIOASSAY ASSEMBLAGE APPROACH = MULTI-SPECIES BIOASSAY Birks H. J. B. (1995) Quantitative palaeoenvironmental reconstructions. In Statistical modelling of Quaternary science data (ed D Maddy & J S Brew), Quaternary Research Association pp161–254. ter Braak C. J. F.(1995) Chemometrics and Intelligent Laboratory Systems 28, 165–180.
GRADIENT ANALYSIS AND BIOINDICATION Relation of species to environmental variables or gradients Gradient analysis: Bioindication: Environment gradient Community Community Environment In bioindication, use species optima or indicator values to obtain an estimate of environmental conditions or gradient values. Calibration, bioindication, reconstruction.
INDICATOR-SPECIES APPROACH The thermal-limit curves for Ilex aquifolium, Hedera helix, and Viscum album in relation to the mean temperatures of the warmest and coldest months. Samples 1,2,and 3 represent samples with pollen of Ilex, Hedera, and Viscum, Hedera and Viscum, and Ilex and Hedera, respectively. From Iversen 1944.
ASSEMBLAGE APPROACH Compare fossil assemblage with modern assemblages from known environments. Identify the modern assemblages that are most similar to the fossil assemblage and infer the past environment to be similar to the modern environment of the relevant most similar modern assemblages. If done qualitatively, standard approach in Quaternary pollen analysis, etc., since 1950s. If done quantitatively, modern analogue technique or analogue matching.
MUTUAL CLIMATIC RANGE METHOD Grichuk et al USSR 1950s–1960s Atkinson et al UK 1986, 1987 ColeopteraTMAX - mean temperature of warmest month TMIN - mean temperature of coldest month TRANGE - TMAX–TMIN Quote median values of mutual overlap and ‘limits given by the extremes of overlap'.
Thermal envelopes for hypothetical species A, B, and C Schematic representation of the Mutual Climate Range method of quantitative temperature reconstructions (courtesy of Adrian Walking).
ASSUMPTIONS • Species distribution is in equilibrium with climate. • Distribution data and climatic data are same age. • Species distributions are well known, no problems with species introductions, taxonomy or nomenclature. • All the suitable climate space is available for species to occur. ? Arctic ocean, ? Truncation of climate space. • Climate values used in MCR are the actual values where the beetle species lives in all its known localities. Climate stations tend to be at low altitudes; cold-tolerant beetles tend to be at high altitudes. ? Bias towards warm temperatures. Problems of altitude, lapse rates. • 495 climate stations across Palaearctic region from Greenland to Japan.
Climate reconstructions from (a) British Isles, (b) western Norway, (c) southern Sweden and (d) central Poland. TMAX refers to the mean temperature of the warmest month (July). The chronology is expressed in radiocarbon years BPx1000 (ka). Each vertical bar represents the mutual climatic range (MCR) of a single dated fauna. The bold lines show the most probable value or best estimate of the palaeotemperature derived from the median values of the MCR estimates and adjusted with the consideration of the ecological preferences of the recorded insect assemblages.Coope & Lemdahl 1995
PROBABILITY DENSITY FUNCTIONS Kühl et al. (2002) Quaternary Research 58; 381-392 Kühl (2003) Dissertations Botanicae 375; 149 pp. Kühl & Litt (2003) Vegetation History & Archeobotany 12; 205-214 Basic idea is the quantify the present-day distribution of plants that occur as Quaternary fossils (pollen and/or macrofossils) in terms of July and January temperature and probability density functions (pdf). Assuming statistical independence, a joint pdf can be calculated for a fossil assemblage as the product of the pdfs of the individual taxa. Each taxon is weighted by the extent of its climatic response range, so 'narrow' indicators receive 'high' weight. The maximum pdf is the most likely past climate and its confidence interval is the range of uncertainty. Can be used with pollen (+/-) and/or macrofossils (+/-).
Distribution of Ilex aquilifolium in combination with January temperature. Estimated probability density function of Ilex aquilifolium as an example for which the parametric normal distribution (solid line) fits well the non-parametric distribution (e.g., Kernel function (dashed line) histogram).
Estimated one- and two-dimensional pdfs of four selected species. The histograms (non-parametric pdf) and normal distributions (parametric pdf) on the left represent the one-dimensional pdfs. Crosses in the right-hand plots display the temperature values provided by the 0.5º x 0.5º gridded climatology (New et el., 1999). Black crosses indicate presence, grey crosses absence of the specific taxon. A small red circle marks the mean of the corresponding normal distribution and the ellipses represent 90% of the integral of the normal distribution centred on . Most sample points lie within this range. The interval, however, may not necessarily include 90% of the data points. Carex secalina as an example of an azonally distributed species is an exception. A normal distribution does not appear to be an appropriate estimating function for this species, and therefore no normal distribution is indicated.
Climate dependences of Carpinus (betulus) (C), Ilex (aquilifolium) (I), Hedera (helix) (H), and Tilia (T) and their combination. The pdf resulting from the product of the four individual pdfs (dotted) is similar to the ellipse calculated on the basis of the 216 points with common occurrences for the four taxa (dashed). No artificial narrowing of the uncertainty range is evident. Climate dependencies of Acer (A), Corylus (avellana) (C), Fraxinus (excelsior) (F), and Ulmus (U), and their combination. The pdf (dotted) resulting from the product of the four individual pdfs has a mean very similar to the mean of the pdf (dashed) calculated based on the 1667 points with common occurrences, but its variances are much smaller.
Reconstruction for the fossil assemblage of Gröbern. The thin ellipses indicate the pdfs of the individual taxa included in the reconstruction, and the thick ellipse the 90% uncertainty range of the reconstruction result.
Simplified pollen diagram from Gröbern (Litt 1994), reconstructed January and July temperature, and 18O (after Boettger et al. 2000).
Reconstructed most probable mean January (blue) and July (red) temperature and 90% uncertainty range (dotted lines) Kühl & Litt (2003)
Comparison of the reconstructed mean January temperature using the pdf-method (green) and the analog technique (blue). Bispingen uncertainty range – 90%; La Grande Pile – 70%.
ENVIRONMENTAL PROXY DATA • Biological data from palaeoecological studies • Pollen, molluscs, foraminifera, macrofossil plant remains, diatoms, chrysophytes, coleoptera, chironomids, rhizopods, moss remains, ostracods • Quantitative counts (usually %) • Ordinal estimates (e.g. 1-5 scale) • Presence-absence data (1/0) at different stratigraphical intervals and hence times
GENERAL THEORY Y - biological responses ("proxy data") X - set of environmental variables that are assumed to be causally related to Y(e.g.sea-surface temperatures) B - set of other environmental variables that together with X completely determine Y (e.g. trace nutrients) If Y is totally explicable as responses to variables represented by X and B, we have a deterministic model (no allowance for random factors, historical influences) Y = XB If B = 0 or is constant, we can model Y in terms of X and Re, a set of ecological response functions Y = X (Re) In palaeoecology we need to know Re. We cannot derive Re deductively from ecological studies. We cannot build an explanatory model from our currently poor ecological knowledge. Instead we have to use direct empirical models based on observed patterns of Y in modern surface-samples in relation to X, to derive U, our empirical calibration functions. Y = XU
In practice, this is a two-step process Regression in which we estimate, modern calibration functions or regression coefficients Training set Ym modern surface-sample data Xm associated environmental data or (inverse regression) Calibration, in which we reconstruct , past environment, from fossil core data TRANSFER FUNCTION Yf fossil core datafossil set
1, 1, 1 variable 1 variable , m taxa , m taxa Ym Y Xm X n t n t samples samples samples samples f o BIOLOGICAL DATA (e.g. Diatoms, pollen, chironomids) ENVIRONMENTAL DATA (e.g. Mean July temperature) Modern data ”training set” Fossil data Unknown To be reconstructed
Outline of the transfer function approach to quantitative palaeoenvironmental reconstruction
Step 2 Calibration to reconstruct past chemistry where Yf = fossil diatom abundance Xf = reconstructed past chemistry (e.g. pH) = inverse of modern species optima from Step 1 GENERAL THEORY OF RECONSTRUCTION Step 1 Regression to estimate modern optima for each species where Ym = modern diatom abundance Xm = modern chemical data (e.g. pH) = estimated modern pH optimum for diatom species
REGRESSION ('CLASSICAL REGRESSION') Y = f (X) + ERROR Estimate f ( ) from training set by regression. The estimated f ( ) is then ‘inverted’ to find unknown x0 from fossil y0. INVERSE REGRESSION = CALIBRATION ‘Plug in’ estimate given Y0 and g
PROXY-DATA PROPERTIES Contain many taxa Contain many zero values Commonly expressed as percentages - "closed" compositional data Quantitative data are highly variable, invariably show a skewed distribution Non-quantitative data are either presence / absence or ordinal ranks Taxa generally have non-linear relationship with their environment, and the relationship is often a unimodal function of the environmental variables
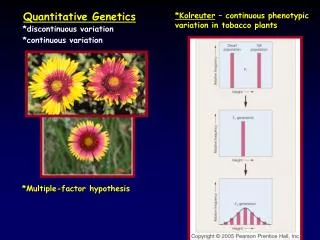
SPECIES RESPONSES Species nearly always have non-linear unimodal responses along gradients trees (m) J. Oksanen 2002
ASSUMPTIONS IN QUANTITATIVE PALAEOENVIRONMENTAL RECONSTRUCTIONS • Taxa in training set (Ym) are systematically related to the physical environment (Xm) in which they live. • Environmental variable (Xf , e.g. summer temperature) to be reconstructed is, or is linearily related to, an ecologically important variable in the system. • Taxa in the training set (Ym) are the same as in the fossil data (Yf) and their ecological responses (Ûm) have not changed significantly over the timespan represented by the fossil assemblage. • Mathematical methods used in regression and calibration adequately model the biological responses (Um) to the environmental variable (Xm). • Other environmental variables than, say, summer temperature have negligible influence, or their joint distribution with summer temperature in the fossil set is the same as in the training set. • In model evaluation by cross-validation, the test data are independent of the training data. The 'secret assumption' until Telford & Birks (2005).
LINEAR-BASED METHODS INVERSE REGRESSION July temperature = b0 + b1y1 + b2y2 + ... bzyz Betula Pinus species parameter [ Y = UX ] 'Classical' Regression ‘response’ (e.g. biology) ‘predictor’ (e.g. environmental variables) Inverse regression is most efficient if relation between each taxon and the environment is LINEAR and with a normal error distribution. Basically a linear model.
Light micrograph of the Quaternary fossil S. herbacea leaf showing epidermal cells and stomata (x40). The cuticle was macerated in sodium hypochlorine (8% w/v) for 2 min and mounted in glycerol jelly with safranin.
CLASSICAL REGRESSION – e.g. GLM Stomatal density = a + b (CO2) + ε Y X response predictor variable variable INVERSE REGRESSION CO2 = a1+b1(stomatal density) + ε Y X response predictor variable variable CO2 past = a1 + b1 (stomatal density of fossil leaves)
Regression plot of the total training set (n=29) for stomatal density of Salix herbacea leaves and the atmospheric CO2 concentration in which they grew. The regression details are as follows: Term Regression Standard t p coefficient error Constant (bo) 294.99 33.248 8.87 <0.001 CO2 (b1) -0.647 0.155 -5.61 <0.001 R2=0.538 R2adj=0.521 Both terms have regression coefficients significantly different from zero and the variance ratio (F[1.27] =31.44) exceeds the critical value of F at the 0.01 significance level (7.68), indicating that stomatal density has a strong statistical relationship with CO2 concentration. Beerling et al. 1995
Late-glacial CO2 reconstructions at Kråkenes, western Norway (38 m a.s.l.)
INVERSE MULTIPLE REGRESSION APPROACH Multiple regression of temperature (Xm) on abundance of taxa in core tops (Ym) (inverse regression). i.e. • Approach most efficient if: • relation between each taxon and environment is linear with normal error distribution • environmental variable has normal distribution • Usually not usable because: • taxon abundances show multicollinearity • very many taxa • many zero values, hence regression coefficients unstable • basically linear model Consider non-linear model and introduce extra terms: Can end up with more terms than samples. Cannot be solved. Hence "ad hoc" approach of Imbrie & Kipp (1971), and related approaches of Webb et al.
Location of 61 core top samples (Imbrie & Kipp 1971) 61 core-top samples x 27 taxa Principal components analysis 61 samples x 4 assemblages (79%) PRINCIPAL COMPONENTS REGRESSION (PCR)
Abundance of the tropical assemblage versus winter surface temperature for 61 core top samples. Data from Tables 4 and 13. Curve fitted by eye Abundance of the subtropical assemblage versus winter surface temperature for 61 core top samples. Data from Tables 4 and 13. Curve fitted by eye Abundance of the subpolar assemblage versus winter surface temperature for 61 core top samples. Data from Tables 4 and 13. Curve fitted by eye Abundance of the polar assemblage versus winter surface temperature for 61 core top samples. Data from Tables 4 and 13. Curve fitted by eye
Now did inverse regression using 4 varimax assemblages rather than the 27 original taxa. Linear where A, B, C and D are varimax assemblages. Non-linear CALIBRATION STAGE using the fossil assemblages described as the 4 varimax assemblages
General abundance trends for four of the varimax assemblages related to winter surface temperatures. Winter surface temperatures "measured" by Defant (1961) versus those estimated from the fauna in 61 core top samples by means of the transfer function. Imbrie & Kipp 1971
Average surface salinities ”measured” by Defant (1961) versus those estimated from the fauna in 61 core top samples. Summer surface temperatures ”measured” by Defant (1961) versus those estimated from the fauna in 61 core top samples. Imbrie & Kipp 1971
Salinity Palaeoclimatic estimates for 110 samples of Caribbean core V12-133, based on palaeoecological equations (Table 12) derived from 61 core tops. Tw = winter surface temperature; Ts = summer surface temperature; ‰ = average surface salinity.
APPROACH AD HOC BECAUSE • Why 4 assemblages? Why not 3, 5, 6? No cross-validation • Assemblages inevitably unstable, because of many transformation, standardization, and scaling options in PCA • Assumes linear relationships between taxa and their environment • No sound theoretical basis
SEGMENTED LINEAR INVERSE REGRESSION Scatter diagrams of: (A) the percent birch (Betula); and (B) the percent oak (Quercus) pollen versus latitude. The thirteen regions for which regression equations were obtained. Bartlein & Webb 1985
Regression equations for mean July temperature from the thirteen calibration regions in eastern North America Region A: 54-71 N; 90-110 W Pollen sum: Alnus + Betula + Cyperaceae + Forb sum + Gramineae + Picea + Pinus July T (oC) = 12.39 + 0.50*Pinus.5 + 0.26*Forb sum + 0.15*Picea.5 (1.61) (.14) (.05) (.10) - 0.89*Cyperaceae.5 – 0.37*Gramineae – 0.03*Alnus (.13) (.08) (.01) R2 = 0.80; adj. R2 = 0.78; Se = 0.96oC n = 114; F = 69.86; Pr = 0.0000 Region B: 53-71 N; 50-80 W Pollen sum: Abies + Alnus + Betula + Herb sum + Picea + Pinus July T (oC) = 8.17 + 0.54*Picea.5 + 0.17*Betula.5 - 0.04*Herb sum – 0.01*Alnus (2.27) (.19) (.14) (.01) (.01) R2 = 0.70; adj. R2 = 0.70; Se = 1.52oC n = 165; F = 95.48; Pr = 0.0000
"We selected the appropriate equation for each sample by identifying the calibration region that; (1) contains modern pollen data that are analogous to the fossil sample; and (2) has an equation that does not produce an unwarranted extrapolation when applied to the fossil sample." Regression equations used to reconstruct mean July temperature at 6000 yr BP. Bartlein & Webb 1985
Isotherms for estimated mean July temperatures (ºC) at 6000 yr BP.
Difference map for mean July temperatures (ºC) between 6000 yr BP and today. Positive values indicate temperatures that were higher at 6000 yr BP than today.
Elk Lake, Minnesota Reconstructions produced by the regression approach