Download
1 / 20
360 likes | 877 Vues
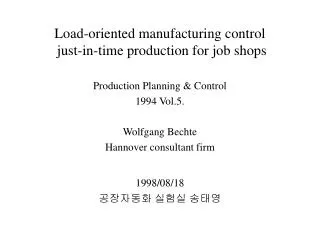
Load-oriented manufacturing control just-in-time production for job shops. Production Planning & Control 1994 Vol.5. Wolfgang Bechte Hannover consultant firm 1998/08/18 공장자동화 실험실 송태영. Introduction. A technique for job shops supporting the JIT concept

E N D
Load-oriented manufacturing control just-in-time production for job shops Production Planning & Control 1994 Vol.5. Wolfgang Bechte Hannover consultant firm 1998/08/18 공장자동화 실험실 송태영
Introduction A technique for job shops supporting the JIT concept - Using load-oriented order release, entry (Bechte, Kettner 1980) - Manufacturing control system is designed by Krautzig. - Implemented in many factories (Wiendahl, Bechte 1987~1991) Basic principles & technique for Load-oriented manufacturing control Detailed computational procedure refer to more theoretical publication written by Wiendahl(1993), Bechte(1988)
content 1. Objectives of load-oriented manufacturing control 2.Structure of load-oriented manufacturing control 3. Basic concept in load-oriented manufacturing control 4.Overview of a load-oriented manufacturing control system 5.Example of the control system
1. Objectives of load-oriented manufacturing control Reducing lead-time and WIP . Keeping actual lead-time on stable lowest possible level. - Permanently In/Out put, inventory and average lead time of W/C are monitored and compared with their planned values in dynamic way At the same time determine Bottlenecks, short & mid-term capacity planning Furnishing realistic due-date scheduling and capacity planning
2. Structure of load-oriented manufacturing control Flow of orders for one single machine Illustrating events, a hierarchical controller levels, sections Figure 1.Funnel model of job shop
Company Sales Prod Schedule Long Term Capacities . DISPOSITION Due Date Order Entry Mid term Capacities Job Shop Lead time Order release Short term Capacities Multi-level closed-loop control system Higher controller level depends on the performance of the lower one. Machine Utilization Operation Sequences Capacities Loading Mfg. Assembly Supplier Receiving Customer Shipping Figure2. Multilevel closed-loop control system Disturbances
3. Basic concept in load-oriented manufacturing control3.1 Basic relationship at a Work center Load [Hours] Final Inventory Input curve Input Avg. Inventory Arriving Orders Avg. Input Avg. Lead time Four simple rules for regulating Input, Output, Inventory and Lead time 1) constant inventory - keep In/Output the same on a avg. 2) changing inventory - change input 3) Average lead time - adjust In/Out ratio 4) Individual lead time to be even - apply FIFO rule while dispatching Avg.lead time = Avg. Inv. Avg. Output Initial Inventory Output Queuing orders Output curve Avg. Inventory Control Period Time [days] Avg. Output Completed Orders Figure 3. Basic relationship and throughput diagram
3. Basic concept in load-oriented manufacturing control3.2 Principle of Load limiting and Load conversion Case A case B Adding Load Load limit Planned Inv. (Buffer) Planned Input Planned lead time Remaining Load Basic relationship at work center to plan the Input, Output, Inventory and Lead time load limit = Planned output * (Planned lead time + Planning period) Planning period Planned output(capacity) Actual Inventory Planning Period Today Figure4. Load limiting
. Rejected Load Exceeding load Required Input Curve Required Buffer Allowed load Present Load Load limit In case that exceeding loads happens Load limiting reject or prefer orders or varies Required capacity = present load * planning period planned lead time + planning period Planned lead time Required capacity Required output curve Figure5. Short-term capacity planning using the load limit
. Full load Converted Load Planned Release(I) Ideal Released Curve Load limit Planned Inv. (Buffer) (D) Order release should consider the work center loads and capacities Four type of loads In case of B,D a statistical estimation is needed ; Load conversion factor depreciation factor = planned output / Load limit = planning period planned lead time + planning period Limiting and balance work in process by order release. Planned Inv. (I) Planned lead time (D) Planned output(capacity) Today Figure6. Derivation of conversion using the load limit
3. Basic concept in load-oriented manufacturing control3.3 Technique of load-oriented order release A considering the available capacities of a short-term planning periods(1~2Week) Planned orders were scheduled backward Selects periodically those of the planned orders Step1. Establish urgent orders Step2. Release wotrkable orders Time limit
. Order 4 Omissible Unworkable 3 Future a Workable 2 Non-Urgent b a c Workable 1 A B C c a b Due If capacities is needed Load-oriented release require appreciate decision Work centers c b a Over due Load [Hours] Released Load Planning period Load limit Time limit Remaining Load Time [Days] today Figure 7. Steps of Load-oriented order release
3. Basic concept in load-oriented manufacturing control3.4 Technique of load-oriented order entry The ideas of Load-oriented order entry is to avoid overloaded weeks Checks the scheduled operation dates against available capacities for a midterm planning horizon (ex 12 weeks) Realistic due dates are offered and the expected bottlenecks are indicated. Initiation capacity changes in advance if possible Overload weeks Free date
. Cumulative Capacity Cumulative Load Load [hour] Underload weeks Overload Weeks Total Load 100% Free Date Overload Portion 83% . Backlog Planning horizon Time [week] Today Figure 8. Cumulative load and capacity of a work center
. A B C D E Realistic Release Date Realistic Delivery Date Order Lead Time A A Operation Lead Time B B Work center . C is a critical work center C C D D Free Date E E Overload Weeks Planning Horizon Time [week] Today Figure 9. Establishing a realistic delivery date of an order
4.Overview of a load-oriented manufacturing control system 1. Routing data 2. Order data 3. Item data 4. Shop calendar 5. Capacity data 6. Transaction data 7. Control data: detailed tables for w/c and free definable group
Graphs Reports Control Data Program Graphs Reports . CONTROL SYSTEM(PC) Routeing Data PROGRAM Control Data DIALOG Order Entry BASIC SYSTEM(HOST) Order Data Capacity Data Transaction Data DIALOG Order Release DIALOG Capacities Item Data PROGRAM Shop Calendar Shop Calendar PROGRAM Transaction Data DIALOG Operation Complete . PROGRAM Order Entry Capacities Entries PLANNING SYSTEM(PC) Planning Data PROGRAM Order Release Capacities Release PROGRAM Operation Sequencing Capacities Sequences Figure 10. Load-oriented manufacturing control system showing the data flow
5.Example of the control system Entry Release Input Output Delivery Disposition Indirect Direct Downstream Upstream Open Cycle 1. The method of basic throughput diagrams is extended (Figure 1 with diagrams) 2. Operation Throughput Element 3. Planned and actual average lead time are computed for each inventory as well as average due-date dev. For release, input, output and delivery Total lead time Wait after operation Transport Wait before operation Setup Run Interoperation time Process time Direct Load time
. 4. Pump-building factory characteristics products 9000 pumps Manufactured parts 26000 different items Manpower(Job shop) 180 persons Work centers 130 (mainly 2 shifts) Orders 350 per week Operations 4,5 per order (Max 20) Run times 3,7 per operation Lot sizes 30 per order(1-1000) Factory began to work with the new system in 1987 Improvement (compared 1991 with 1987) Inventory was twice as high in 1987 Most delivery higher than in 1987 Cycle lead time(release ~ delivery)were cut from almost 8weeks to 5weeks Due-date deviations 4.5 to 1 week (lateness) Total lead time(entry~delivery) 14weeks to 9 weeks
Conclusion Load-oriented manufacturing control system enables the factory 1. Reducing lead time and inventories 2. Keeping actual lead time on a planned level 3. Meeting the planned due dates 4. Maintain an appropriate work-center utilization results in safer scheduling foundation for JIT production