Download
1 / 10
100 likes | 292 Vues
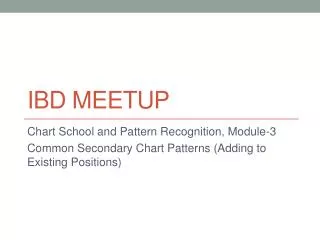
Milwaukee IBD Group. http://www.meetup.com/MilwaukeeIBD /. Aaron Hannemann , a member of the Milwaukee IBD MeetUp group, was the featured speaker on Tuesday evening May 28, 2013. Following is a summary of his presentation. Fundamentally Speaking. Aaron Hannemann.

E N D
Milwaukee IBD Group http://www.meetup.com/MilwaukeeIBD/ Aaron Hannemann, a member of the Milwaukee IBD MeetUp group, was the featured speaker on Tuesday evening May 28, 2013. Following is a summary of his presentation.
Fundamentally Speaking Aaron Hannemann
Our goal tonight is to learn how to quickly scan the IBD newspaper and find the crème de la crème, the best-of-the-best stocks to add to our watch list. The watch list will be narrowed down to a few stocks with extremely strong fundamentals, stocks that best meet the IBD fundamental criteria. The idea is to eliminate weak stocks from the list. “When in doubt, throw them out” will be used on stocks that are close to meeting the criteria or are questionable for any reason. • Here is a list of charts found in the IBD newspaper • that can, and should, be used in the scan: • The IBD50 list found in the Monday and Wednesday editions of IBD • The Big Cap 20 list found in Tuesday’s paper • The IBD 85-85 list found in Your Weekly Review on Fridays • The Stock Spotlight and Sector Leaders Charts
The first criteria in our scan is that Sales have increased greater than 25%. Sales > 25%
The second criteria in our scan is that Earnings have increased greater than 50%. EPS > 50% Note that REGN’s Earnings per Share was up 381%, but down from the 497% in the prior quarter. Note that there is no data about the Annual EPS Growth which may require further research or elimination from our watch list.
The third criteria in our scan is that the PEG ratio is less than 0.5 PEG < 0.5 The Price/Earnings ratio (PE) has little meaning by itself until it is compared to the growth of the company. The PE divided by earnings growth is the PEG and it provides the investor with an idea of value. It indicates whether the investor is overpaying (PEG>1) or buying a bargain (PEG<1). In this case REGN’s is PEG = 41/381 or 0.11
The final criteria (Debt to Equity) needs to be added in context to interest rates. In the monthly chart of TLT (iShares of the 20+ year Treasury Bond) the 6 month EMA (yellow) is crossing down through the 10 month EMA (blue) indicating that Treasury Bonds are trending lower and future interest rates will be rising.
If future interest rates were falling, the debt to equity would not be an issue and this criteria could be excluded from the scan. However, since rates look like they will be rising, companies with debt on their books will have increased difficulty. The fourth criteria is that D/E < 60%
Each member of the group had a copy of the IBD newspaper during our meeting. After looking at several charts and determining whether or not to add the stock to our watch list, the group got rather adept and the scan moved quite quickly. Before long we had a “short list” of stocks with strong fundamentals. • The next step in our process was to use our “short list” to look for entry points on our stock charts. Many of the charts in IBD already described entry points under the charts. We used the following technical formations to select additional buy points. • 1st or 2nd base • Three weeks tight • Cup & handle • Double bottom • Flat Base • Pocket Pivots • Moving Averages • Buyable gaps up
Finally, we need to consider Risk Management and Pyramiding additional funds in a successful investment. Limiting the amount of the initial investment prevents putting the portfolio at risk and saves additional funds for future entry points. • For Small Cap. Stocks (under $250M) – Initial investment of 3% of portfolio with 2%, then 1% added later. • For Mid Cap. Stocks ($250M to $1B) – Initial investment of 4.5% of portfolio with 3%, then 1.5% added later. • For Large Cap. Stocks ($1B and above) – Initial investment of 6% of portfolio with 4%, then 2% added later. Aaron added this comment the following morning: “I don't like to use percent pyramid schemes in general. Ideally, I like to wait for a second technical signal for my second purchase. If I really like the story on a stock I'll not wait, but move right in on any signs of strength. I didn't mention it last evening, but I usually take a position in a stock and then begin to work on the story. As you know when a technical signal appears one has to act. But, after that initial position is when I begin to investigate the "story" behind a stock. Hope this is helpful ...”