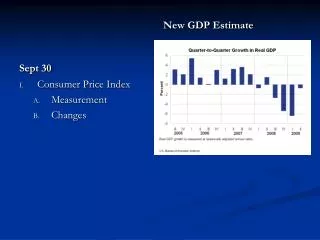
Sept. 30
Sept. 30. HSPM J712. Demand and Need. Need. Demand. Objectively observable as behavior in the market. Money is a key factor. Demand is expressed only by spending money. "Demand" is therefore also called "effective demand.”. Someone's subjective idea

Sept. 30
E N D
Presentation Transcript
Sept. 30 HSPM J712
Demand and Need Need Demand Objectively observable as behavior in the market. Money is a key factor. Demand is expressed only by spending money. "Demand" is therefore also called "effective demand.” • Someone's subjective idea • May be based on a formula applied objectively to a particular case, but the choice to use the formula was someone's subjective idea. • Money is not a factor.
Elasticity • Elasticity of demand is a way to measure how the quantity demanded responds to price changes. • Elasticity = responsiveness • In a particular sense
Slope • Slope has units. Elasticity does not.
Slope and elasticity related Alternative elasticity formula: • Slope has units. Elasticity does not. • If the elasticity is constant, the slope is changing
A way to interpret an elasticity of demand number • Suppose you raise the price of something you're selling. Will you make more money?
Insurance and risk • Insurance is a financial transaction • You (the insured) pay the insurer to assume risk for you. • You pay more than the expected value of the insurance payout. The difference is your risk premium. • The risk premium covers the cost of administering the insurance.
Risk pool • A way to think about it instead of expected value • You and a bunch of others agree that if any of you suffer a loss, you will all chip in to pay for it. • Mutual insurance
Two kinds of risks that you should not insure against If there is administrative cost (but not if the pool has market power) then do not insure: • 1. High-probability events If it's sure to happen, then you're going to be paying for it anyway. If the insurance company pays for it, they'll charge you what you'd pay plus their administrative cost. Pay for it directly yourself and you save the administrative cost.
Two kinds of risks that you should not insure against If there is administrative cost (but not if the pool has market power) then do not insure: • 2. Low-cost events If you can afford to assume the risk yourself, why pay extra to somebody else? (Assumes that the insurance is tailor-made for you. If the premium is based on a group's experience, and your risk is higher than the group average, insurance may be a winning deal for you.)
Assumptions – Context – makes a difference • That analysis assumes away an important circumstance under which more comprehensive insurance might be better than less: • If insurers have market power, they may be able to get a better price than an individual buyer could get. The price discount could offset the insurer’s administrative cost. • Medicare, for example, is a buyer's monopsony for the elderly in the U.S. That is why pharmaceutical companies are so against having Medicare negotiate prescription drug prices.
Assumptions – Context – makes a difference • If you don’t have insurance, then you pay out of pocket. • Billing and collecting customer payments itself involves administrative expense.
Assumptions – Context – makes a difference Oddly, the standard assumptions are that • Insurance has administrative cost But • Market transactions don’t. • That’s wrong! Much can be saved if there is no billing of patients. • In Canada, hospitals operate on lump-sum annual payments from government. There are no patient copayments. Because of this, hospitals need billing departments only to charge foreigners. The administrative cost savings are immense.
Comprehensive insurance • Comprehensive insurance • Low copayments • Covers lots of conditions and treatments • Less-comprehensive insurance • High copayments • Excludes a lot of conditions and treatments
Comprehensive insurance tends to be a bad buy • In a competitive insurance market • With insurance policies being offered with different copayments or comprehensiveness • And premiums based on the average risk of the insured group • Due to selection by buyers (subscribers): Comprehensive insurance will be a bad deal for average-risk people
Due to buyer selection • Buyers expecting to have more health care costs will buy more comprehensive insurance. (That’s the selection.) • The comprehensive insurance group will then have more claims expense. • The premium for joining that group will rise. • If your risk is average, comprehensive insurance will have a premium much higher than your expected value.
Irony of pre-existing condition exclusions • Selection by the company overcomes buyer selection and enables lower-risk people to buy comprehensive insurance at an appropriate price.
Community rating = Everyone in the community pays the same premium. • Experience rating = People are classed into groups. The premium is determined by the experience of the group. This attempts to customize the premium so that it reflects each individual's probability of having a claim. Groups can be determined by age, sex, habits, medical history, etc. Underwriting is the insurance term for calculating risks and adjusting premiums accordingly.
Experience rating drives out community rating • If allowed, insurance plans arise that identify a lower-risk group and offer a lower premium than the community premium. • The community plan is left with higher risk people. The community premium rises. • Go to Step 1, until the community plan has only the highest risks and the highest costs. • Unregulated competition can lead to perverse outcomes
A failure of Arrow’s assumption that anything you need is being sold • Having a known risk is a financial calamity • Being diagnosed with diabetes or HIV can cause you to lose your health insurance or have to pay much more for it. • But you can’t buy insurance against having a known risk. • Insures won’t offer that. • The private market for insurance is not optimal (or efficient).
Arrow: Where there is not optimality, society develops alternatives to the free market, such as • Government insurance to everybody in certain risk groups • Medicare for elderly, dialysis, … • Medicaid for moms, children, disabled • For some private insurance, once you get in, you can renew, even if you become more risky.
Arrow extended: Where there is not optimality, we develop proposed alternatives to the free market: • Government pays risk-adjusted subsidies to counter risk-adjusted insurance premiums. • Outlaw underwriting (= risk-adjusted insurance premiums) • Outlaw exclusions of certain conditions or treatments • Uniform standard for minimal coverage
Current policy implications • Suppose the US keeps the system of having health insurance companies sell health insurance, but bans exclusions for pre-existing conditions. • Where does that lead? • Insurers will charge higher premiums for persons with pre-existing conditions
Current policy implications • Suppose the US then bans charging higher premiums for persons with pre-existing conditions? • i.e. requires community rating • People with known pre-existing conditions will flock to policies that cover care for those conditions with low copayments. • Claims cost will rise for comprehensive plans, so their premiums will rise.
Moral hazard • … if having insurance increases the probability that an insured-against event will occur. • In particular • … if having health insurance means you’ll get more health care than you otherwise would have.
Moral hazard • Let’s look at some important studies • Then, contemporary commentary
RAND health insurance experiment • Brook, R.H., et al, "Does Free Care Improve Adults' Health? Results from a Controlled Trial of Cost Sharing in Health Insurance," N Engl J Med, December 8, 1983, 309, pp. 1426-1434. • How big is moral hazard in health insurance? • How much does health insurance induce people to buy health care that they don't much need?
RAND health insurance experiment • Brook’s is one in a series coming out of the $70 million government-funded RAND health insurance study done around 1980. In this part of the study: • 3958 adults (teens up to Medicare) • Followed over 8 years. • 14 insurance plan copayment schemes tried, including • Free care – no copayment • Various copayments of 25 to 50% • 95% payment for all services until the family had spent 15% of its income or $1000, whichever was less.
Effect of copayment on health care demand • Adults who had to pay used about 2/3 of the ambulatory visits and hospitalizations of those who didn't. • An earlier article (Newhouse et al, NEJM 305(25) Dec. 17, 1981, 1501-7) reported this. • There was little or no significant difference among the pay plans. As far as they could tell, 25% copayment had the same effect as 95%.
Income and the demand response to copayment • Low income families responded more to copayments than higher income families • but not by much in most years and locations. • Low income families with illnesses would exceed their deductible sooner than higher income families, because the deductible was 15% of family income.
Need-- the effect of copayment on health • For the whole population, differences in health status are found only for persons with poor vision or high blood pressure. • Among elevated-risk persons (worse 25%), free plan had: • Lower blood pressure (at 0.07 level), • Better far vision (0.02 level) • Lower risk of dying (0.001 level)
Copayments make health worse for lower income people • The impact of cost sharing on health is clearest in lowest income group (bottom 20%). • Not clear if cost sharing has an impact on the health of the non-poor. • “Clear” here means statistically significant
Conclusion: Free care not cost-effective • Authors say: Specifically targeted programs (vision, hypertension, especially for poor) are more cost-effective than free care for all at improving health among the public. • (Cost effective means more bang for the buck.) • In other words, they advocate having programs for free care for the conditions for which they found a health effect of copayments.
Health habits and copayments • No effect found • Economic theory might imply that people will do more risky things if their health care will be paid for.
Cash payments to equalize benefit • People who had the 95% copayment plan got a cash payment of about $80 a month. • This gave them cash that they could spend on health care, if they chose, but they could chose to spend it on something else instead. • Orthodox economists believe that it's better to give people money than services of the same value. That way people can spend the money in a way that maximizes their satisfaction. If they want medical service, they can buy it, but if they want something else more, they can buy that.
Cash payments to equalize benefit • Put another way, the investigators thought that many people would rather forgo seeking medical care for some minor (to them) conditions and spend the money saved on something else. • If care is free, a person may go to the emergency room and spend $100 worth of society's resources on treatment of a headache, say. If the person has to pay part or all of that $100, he or she may prefer to take a 5-cent aspirin at home and spend the other $99.95 on something else. Either way uses up $100 worth of society's resources, but the second way gives the person with the headache more “utility.”
Limited of scope of applicability • The high-copayment plan in the experiment was better than what the poor usually have, because poor people don’t get a monthly stipend to compensate them for not having health insurance. • Sample excluded children and the elderly and the disabled. • Measures of health status not all sensitive.
What we’re willing to pay to meet similar need • Himmelstein, D.U., Woolhandler, S., "Free Care, Cholestyramine, and Health Policy," N Engl J Med, December 6, 1984, 311, pp. 1511-1514.
What we’re willing to pay to meet similar need • Cholestyramine controls cholesterol and reduces the risk of death from heart disease, but daily therapy cost $1861.50 per year for the drug alone. That works out to: $9,300,000 average cost per life saved $780,000 per coronary heart disease death or non-fatal MI (heart attack) averted. Free health care for all men over 50 saves lives at an average cost per life saved of $654,000 (compared with 95% copayment), or $378,000 (compared with 50% copayment). Free care for everyone saves lives at average cost of $726,700.
Copayments and ER use • O'Grady, K.F., Manning, W.G., Newhouse, J.P., Brook, R.H., "The Impact of Cost Sharing on Emergency Department Use" N Engl J Med, August 22, 1985, 313, pp. 484-490. • The effect of copayment is greater for less serious diagnoses. Compared with free care, coinsurance plans combined had • 77% as many visits for "more urgent" complaints • lacerations, • 2nd degree burns, • urinary tract infection, • head injury, • chest pain -- for these last two, copayment didn't affect visits
Copayments and ER use • Compared with free care, coinsurance plans had • 53% as many visits for "less urgent" complaints • abrasion, • sprain, • upper respiratory infection, • Gastro-intestinal complaints, • headache -- only 11% as many visits as free care • 1st degree burn -- 28% as many visits as free care
Copayments and ER use • Compared with free care, coinsurance plans had • 53% as many visits for less urgent complaints • 77% as many visits for urgent complaints • Is that OK or is it neglected need? • Within insurance groups, persons in the lower 1/3 of the income distribution used the ER 64% more than persons in the upper 1/3. Maybe the poor were accustomed to ER use. Maybe there was a lack of private docs where the poor were.
Copayments and seeking care for serious and minor symptoms • Shapiro, M.F., Ware, J.F., Sherbourne, C.D., "Effects of Cost Sharing on Seeking Care for Serious and Minor Symptoms," Annals of Internal Medicine, February 1986, 104, pp. 246-251. • For those with minor symptoms, cost sharing meant 1/3 less visits. For serious symptoms, cost sharing doesn't affect the propensity to seek care for the upper 60% of the income distribution. • For the lower 40%, cost sharing reduces demand for care for serious symptoms.
Copayments and health • Health status measured by presence of various symptoms in annual survey. Survey asked about health status during previous month. • Among those who were sick when the HIE (health insurance experiment) began, the poor reported more symptoms than the non-poor. • During the HIE, the sick poor in the free care plan improved to where they were no sicker (serious symptoms) than the non-poor. • The sick poor in the copayment plans also improved some, but remained sicker (serious symptoms) than the non-poor.
Copayments and health • Why did both sick groups improve? • Authors say: Regression towards the mean. Whenever you divide people into a sick group and a well group, some people in the sick group will get better on their own. Meanwhile, some people in the well group will get sick. • I might add, as mentioned above: Even the 95% pay plan was better than what many of the poor had before. They now had cash to spend, and they had insurance against big expenses.
A non-RAND study of copayments and demand for care • Blustein, J., "Medicare Coverage. Supplemental Insurance, and the Use of Mammography by Older Women," N Engl J Med, April 27, 1995, 332(17), pp. 1138-1143. • In the early 1990's, Medicare stared to pay for mammograms for screening for breast cancer. • Medicare already paid for diagnostic mammograms for women whose examinations found lumps. • Economic factors affect even those on Medicare. OK, you're not surprised.