Download
1 / 25
250 likes | 412 Vues
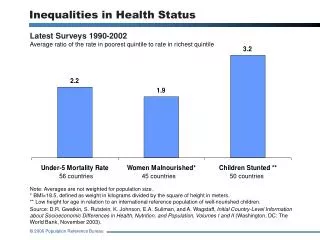
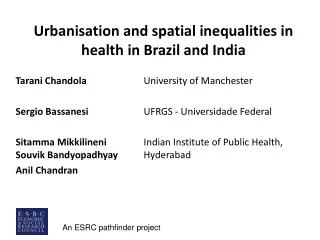
Urbanisation and spatial inequalities in health in Brazil and India. Tarani Chandola University of Manchester Sergio Bassanesi UFRGS - Universidade Federal Sitamma Mikkilineni Indian Institute of Public Health, Souvik Bandyopadhyay Hyderabad Anil Chandran.

E N D
Urbanisation and spatial inequalities in health in Brazil and India Tarani Chandola University of Manchester Sergio Bassanesi UFRGS - Universidade Federal Sitamma Mikkilineni Indian Institute of Public Health, SouvikBandyopadhyay Hyderabad Anil Chandran An ESRC pathfinder project
Plot showing the odds ratios (ORs) and 95% confidence interval (CI) for one-standard deviation change in Gini coefficient for the risk of being underweight, pre-overweight, overweight and obese. Subramanian S V et al. J Epidemiol Community Health 2007;61:802-809 ©2007 by BMJ Publishing Group Ltd
Most deprived www.equalitytrust.org.uk Health is related to income differences within rich societies but not to those between them Between (rich) societies Within societies Source: Wilkinson & Pickett, The Spirit Level (2009)
Increasing income inequality in Brazil and India • Increasing spatial inequality in poverty and income • urbanisation and concentration of economic activity • spatial concentration of affluence reproduces privileges of the rich • spatial concentration of poverty results in segregation, involuntary clustering in ghettos • Effects on Individual and Population Health? • “Triple health jeopardy: being poor in a poor neighbourhood that is spatially isolated from life-enhancing opportunities…” Nancy A Ross
Calculating index of dissimilarity for a geographic area Suppose: pi = the poor population of the ith areal unit, e.g. census tract P = the total Poor population of the large geographic entity for which the index of dissimilarity is being calculated. ri= the rich population of the ith area unit, e. g. census tract R = the total Rich population of the large geographic entity for which the index of dissimilarity is being calculated I.D. measuring the segregation of poor from rich= (1/2)* SUM |(pi /P – ri / R) | Interpretation: The proportion of the poor population that would have to move areas, to become distributed across the areas in the same way as the rich population
Calculating isolation index of segregationpi = the poor population of a component part, for example, census tracts, of the larger geographic entity for which the isolation index is calculated. ti= the total population of a component part of the larger geographic entity for which the isolation index is calculated. P = the total poor population of the larger geographic entity for which the isolation index is being calculated. Then the isolation index for poor groups= SUM(pi / P) * (pi / ti) Interpretation: The probability that a poor person will meet another poor person locally. This is equivalent to the probability that a poor person will not meet someone of another group. However, the indices of dissimilarity and isolation are aspatial measures.
EVENNESS ISOLATION EXPOSURE CLUSTERING Dimensions of spatial segregation Sean F. Reardon & David O'Sullivan. “Measures of Spatial Segregation” Sociological Methodology. V. 34, n.1, p. 121-162, 2004
Transform aspatial segregation measures into spatial measures Localities: An urban area has different localities where people live and exchange experiences with their neighbours. Measure the intensity of these exchanges by assuming this intensity varies by the spatial distance between population groups. Each locality has a core: geometrical centroid of an areal unit. The population characteristics of the locality are expressed by its local population intensity. Use a kernel function and a bandwidth parameter to estimate this local population intensity.
EXPOSURE/ISOLATION DIMENSION SPATIAL EXPOSURE INDEX Average proportion of group n in the localities of each member of group m SPATIAL ISOLATION INDEX Average proportion of group m in the local environments of each member of group m (spatial exposure of group m to itself)
EVENNESS/ CLUSTERING DIMENSION SPATIAL NEIGHBOURHOOD SORTING INDEX Proportion of the variance between the different localities that contributes to the total variance of the variable X in the city GENERALIZED SPATIAL DISSIMILARITY INDEX Average difference of the population composition of the localities from the population composition of the urban area as a whole
Key research question: • What is the evidence of a triple health jeopardy in relation to mortality in Brazil and India? • Methods: • Brazil Data (for the 10-15 largest cities): • Demographic and Socioeconomic data: 2000 Census (census tract level) • Mortality data: SIM Mortality Information System (district level data) • India Data (for largest 50 cities): • Demographic and Socioeconomic data: 2001 census (urban ward level) • Mortality data: District Level Household and Facilities Survey 2002-04 and 2007-08 (Individual, neighbourhood and urban ward level)
EVENNESS EXPOSURE ISOLATION CLUSTERING Dimensions of spatial segregation
SpatialCLUSTERING INDEX Moran Cluster Map Moran Scatter Plot SLOPE OF THE REGRESSION LINE Spatially lagged variable Variable to be lagged, standardized
SpatialCLUSTERING INDEX Within each district, the Spatial Clustering Index is the proportion of census tracts that are low income tracts and are surrounded by other low income tracts.
EVENNESS ISOLATION EXPOSURE CLUSTERING Dimensions of spatial segregation
Spatial Isolation IndexIncome >20 ms BW:400m GLOBAL Ŏ>20=0.228 p<0.01 LOCAL
10-20 ms Local Spatial Isolation Indexes Income Groups BW:400m ms: minimum salaries >20 ms 2-5 ms <2ms 5-10 ms
INCOME Moran I Index: 0.65 ( ρ< 0.0001) Distribution of income of the head of the household by district, Porto Alegre, 2000. Source: IBGE
AGE AND SEX ADJUSTED MORTALITY RATE 10.0 5.4 Distribution of age and sex adjusted mortality rate by district, Porto Alegre, 2000. Source: DATASUS-SIM
CARDIOVASCULAR DISEASES MORTALITY 45-64 YEARS CVD Deaths by 100,000 Distribution of age specific cardiovascular diseases mortality coefficient* , adjusted for age and sex, by district. Porto Alegre, 2000-2004. Sources: IBGE and SIM * results after smoothing
Conclusions: - Evidence for “triple health jeopardy” - Being poor in a poor neighbourhood that is spatially isolated from life-enhancing opportunities is associated with higher mortality - Socioeconomic segregation is an important spatial dimension of inequalities in health For futher information: http://www.ccsr.ac.uk/staff/tc.htm An ESRC pathfinder project