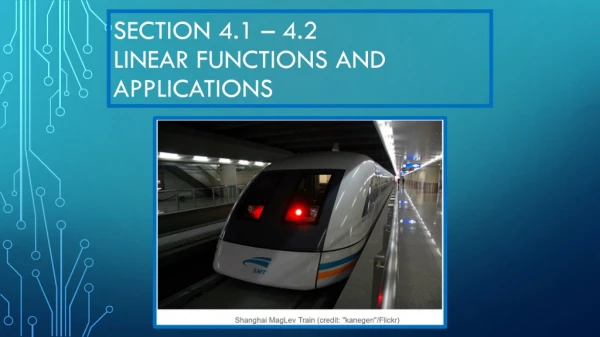
Linear Functions and Applications
120 likes | 333 Vues
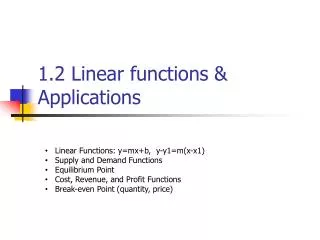
Linear Functions and Applications. Lesson 1.2. A Break Even Calculator. Consider this web site which helps a business person know when they are breaking even (starting to make money). Note that the graph is a line . Quite often, break even analysis involves a linear function.

Linear Functions and Applications
E N D
Presentation Transcript
Linear Functions and Applications Lesson 1.2
A Break Even Calculator • Consider this web site which helps a business person know when they are breaking even (starting to make money) Note that the graph is a line. Quite often, break even analysis involves a linear function.
Linear Function • A relationship f defined by for real numbers m and b is a linear function • The independent variable is x • The dependent variable is y
Supply and Demand • Economists consider price to be the independent variable • However • They choose to plot price, p, on the vertical axis • Thus our text will consider p = f(q) That is price is a function of quantity • Graph the function(the calculator requiresthat x be used, not q)
Supply and Demand • The demand for an item can also be represented by a linear function • On the same set of axes, graph Note: we are only interested in positive values, Quadrant 1. Reset the window with ♦E
Supply and Demand • Set window for 0 < x < 3, 0 < y < 5 • Use the Trace feature (F3) to note values of quantity and price Supply Demand Price Quantity
Supply and Demand • What is the price and quantity where the two functions are equal? • This is called the point of equilibrium Intersection may be found symbolically or by the calculator. Supply Demand Price Quantity
Surplus Shortage Supply and Demand • Surplus is when excess supply exists • Shortage is when demand exceeds supply Supply Demand
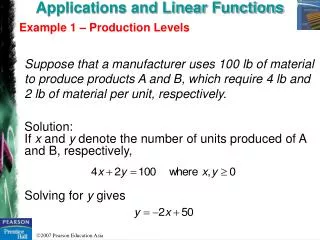
Cost Analysis • Cost of manufacturing an item usually consists of • Fixed cost (rent, utilities, etc.) • Cost per item (labor, materials, shipping …) • This fits the description of a linear function • The slope m is considered the "marginal cost" • The y-intercept b is the fixed cost
Break Even Analysis • We compare Cost function with Revenue Function • Revenue is price times number sold • Usually you must sell a certain number of items to cover the fixed costs … beyond that you are making a profit • When R(x) > C(x) • The break even point is when R(x) = C(x)
Profit C(x) loss R(x) Break Even Analysis • Given • Graph both and determine the point of equilibrium
Assignment • Lesson 1.2 • Page 28 • Exercises 1 – 25 odd,29, 31, 37, 39