Download
1 / 30
300 likes | 384 Vues
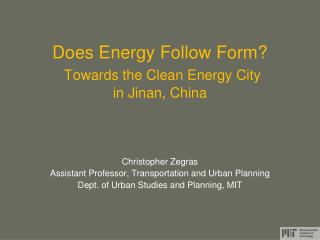
This study by Christopher Zegras, Assistant Professor at MIT, explores the relationship between energy consumption and urban form in Jinan, China. It delves into the impact of neighborhood design on operational and embodied energy use, transportation energy, and greenhouse gas emissions, using a multivariate analytical approach. By analyzing different neighborhood typologies and household characteristics, the research reveals insights on energy consumption patterns and potential reductions in energy use. Implications for transitioning to clean energy, rethinking urban design principles, and shaping attitudes and behaviors towards energy efficiency are discussed. The study also introduces the "Energy Pro-forma," a decision support tool for designers and developers to evaluate the performance of different development patterns in terms of energy use. This comprehensive analysis aims to contribute to the development of sustainable and energy-efficient cities.

E N D
Does Energy Follow Form?Towards the Clean Energy Cityin Jinan, China Christopher Zegras Assistant Professor, Transportation and Urban Planning Dept. of Urban Studies and Planning, MIT
Neighborhood Design as a Solution Space? Something new?
Life Cycle Analysis Household (2) Operational Energy (1)Embodied Energy Building (3)Travel Energy Streets, neighborhood Construction Use Phase Demolition
Neighborhood Form Physical Structure Households Common Area Common Area Conditions Travel Conditions In-home Conditions Vertical Movement Job HVAC Lighting School Water Heating Parking Shopping Lighting Security Material and Construction Others Cooking Others Devices and Appliances Devices Vehicles Use Movement Use Travel Energy Use and GHG Emissions Operational Energy Use & GHG Emissions Embodied Energy Use & GHG Emissions “Moving” “Fixed”
Multivariate Analytical Approach HH Appliance/Device Ownership (e.g, # vehicles) = f (HH Characteristics, Neighborhood Type & Location) Selection bias and endogeneity Operational and Travel Energy Use = f (# appliances/devices, HH characteristics, Neighborhood Type & Location)
“Vector” representation e.g.: Density Diversity Design Relative Location But, these variables are, in reality, limited And, maybe the “whole > ΣParts”? How to “measure” the neighborhood? Typological Representation
The Neighborhoods Studied (Traditional) (Superblock) (Enclave) (Superblock) (Enclave) (CommercialDistrict) (Enclave) (Enclave) (Superblock) Source: School of Architecture, Tsinghua University
Energy Consumption per Household Superblock Enclave Grid Trad.
Average Household Operational Energy Consumption by Neighborhood (MJ)
Annual Average Household Energy Use (MJ) Jinan, USA, Canada Sources: US EIA, 2005; NRC, 2007.
Operational Energy: Some Insights(all else equal) • Hot and cool neighborhoods? • Superblocks = ↑ air conditioner (AC) ownership • AC HHs = ↑ 18%-26% CO2 than non-AC HHs • Solar friendly neighborhoods? • Non-Superblocks = ↓ solar hot water heater (SHW) ownership • SHW HHs = ↓ 8% less CO2 than non-SHW HHs • A High-rise, “compact” compromise? • Elevators, water pumps, underground parking • Up to 25% of per household annual CO2
Household Weekly Transport CO2 Emissions by Household Monthly Income (US$)
Estimated Expected Reductions in Household Travel Energy Due to: Measures
In Sum • Operational (especially in-home) energy use = 70-80% of household energy use • Transportation = next largest share • Except in low-transport demand neighborhoods • But, transportation energy seems much more sensitive to urban typology… • And, transport growth likely to exceed in-home energy use growth • Superblock already = 45% of Canada/US HH in-home energy use • Superblock only = 15%-25% of Canada/US HH travel energy use
Some Implications • Coal-to-clean energy transition needed • Coal responsible for >50% of household total energy use/emissions • Rethinking the Superblock • Increases in-home, common area, embodied and transportation energy use • Revisit the desired design principles of, especially, the Enclave • Location matters • Less distant developments reduce travel energy use • On-BRT corridor displays mixed effects
Some Implications • Size matters • Home size strongly determines in-home energy use • Smaller homes, with location convenience, in neighborhoods with “out of home” attractions. • The ownership society • Ever more money, ever cheaper goods • How to move these forces towards more efficiency?
Some Implications • Shaping attitudes, changing behaviors? • Measured attitudes (value of time, public transport preference, towards car ownership) significantly impact measured in home and travel energy use and device ownership • High leverage preference shaping policy window might be shrinking… • How to defensibly bring residential neighborhood development into local and global pollutant regimes? • We are developing a tool to help quantify relevant effects….
The “Energy Pro-forma” • Objective: • Decision support tool to enable designers/developers to explore and compare performance across development patterns • Approach • Life-cycle.. • Systematic • Empirically based • User friendly??? • Inspired by the pattern book design elements