Download
1 / 19
190 likes | 300 Vues
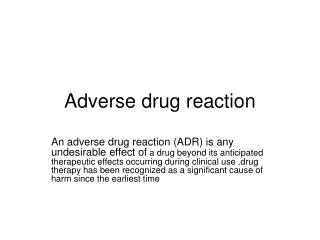
A Proof-of-Concept Evaluation of Adverse Drug Reaction Surveillance in Electronic Health Records. Zarif Jabbar-Lopez, MBBS, MPH FY2, East of England Deanery Visiting Research Fellow, Uppsala Monitoring Centre. Disclosure. No conflicts of interest

E N D
A Proof-of-Concept Evaluation of Adverse Drug Reaction Surveillance in Electronic Health Records Zarif Jabbar-Lopez, MBBS, MPH FY2, East of England Deanery Visiting Research Fellow, Uppsala Monitoring Centre
Disclosure No conflicts of interest The research leading to these results was conducted as part of the PROTECT consortium (Pharmacoepidemiological Research on Outcomes of Therapeutics by a European ConsorTium, www.imi-protect.eu) which is a public-private partnership coordinated by the European Medicines Agency. The PROTECT project has received support from the Innovative Medicine Initiative Joint Undertaking (www.imi.europa.eu) under Grant Agreement n° 115004, resources of which are composed of financial contribution from the European Union's Seventh Framework Programme (FP7/2007-2013) and EFPIA companies' in kind contribution. The views expressed are those of the authors only
Background • Why surveillance? • Want to detect new and unexpected adverse events • Why Electronic Health Records (EHRs)? • Routinely collected • No additional reporting burden by clinician • Know numbers exposed • Large – power to detect infrequent events
Methods: Database • The Health Improvement Network (THIN) Database • UK Primary care EHR database • Medical events and prescriptions • Data collected in routine practice • Over 7 million patients • >500 practices • 1987 to 2011
Methods: Screening • Information Component (IC) Temporal Pattern Discovery Method (Norén et al., 2010) • Based on self-controlled cohort design • Identifies medical events registered more frequently in 1 month after new drug prescription compared to control periods two years earlier, one month prior and on the day of prescription • External control group to adjust for time-trend bias Data Min Knowl Disc (2010) 20:361–387
Methods: ICTPD screening output • Output is ICΔ – change in information component • ICΔ related to O/E event ratio before and after exposure but also incorporates statistical ‘shrinkage’ • Used lower confidence boundary of ICΔ (ICΔ025) > 0 as cutoff for highlighting drug-event pairs • Changes in IC over time (relative to prescription) can be visualised as a chronograph: Data Min Knowl Disc (2010) 20:361–387
Results: Overview • New prescriptions ranged from 85,000 (minocycline) to 1.2 million (hydrocortisone) • In total 342 temporal associations highlighted on initial screening of the 10 drugs • 23 (7%) known ADRs (vs. UK summary of product characteristics) • 319 (93%) required further evaluation to see whether true or false positives
Further evaluation of the 319 highlighted pairs that were not known ADRs • 168 (53%) were due to administrative/ ‘irrelevant’ clinical codes • 151 (47%) required detailed review of chronographs, case series and individual case level data • Of these, none were thought likely to be true signals
Admin/’irrelevant’ clinical events • Examples include: • ‘Referral to’ • Ambiguous clinical codes e.g. ‘[SO]Anterior chamber of eye’ • Congenital disorders • Cancers
Detailed review of remaining 151 highlighted drug-event pairs • Protopathicbias: 69 (45%) • Confounding by indication: 40 (26%) • Other reasons (29%): • Chance • Synonymous terms e.g. ‘Type 2 diabetes mellitus’, ‘diabetes mellitus’, ‘diabetes mellitus with no mention of complication’, ‘non-insulin dependent diabetes mellitus’
Reasons for low sensitivity? • Method • Method too ‘severe’? High specificity at the cost of sensitivity • Perhaps we could tolerate a higher false positive rate • Drugs • Relatively safe drugs with generally minor adverse event profiles • Data • Lack of reporting (by patient) or recording (by clinician) • Prescriptions, not use
Next steps • Vary threshold for highlighting drug-event pairs to increase sensitivity (at a cost of specificity) • Ensure better groupings of Read terms to reduce highlighting synonymous events • Different formulations have different expected AE profiles – restriction to certain formulations/routes of administration might be useful • Different drugs
Conclusions • 10 drugs for skin disease were screened for adverse events in a real-world primary care EHR database • Overall low sensitivity and high specificity in this pilot study using ICTPD • Automated filtering of administrative codes could significantly reduce workload • Protopathic bias and confounding are issues • Further work needed to refine the method and see if the results generalise beyond the 10 derm drugs considered here
Acknowledgements • Niklas Norén, Tomas Bergvall, Kristina Star • PROTECT PROTECT queries: niklas.noren@who-umc.org General queries: zjabbarl@post.harvard.edu