Download
1 / 14
140 likes | 307 Vues
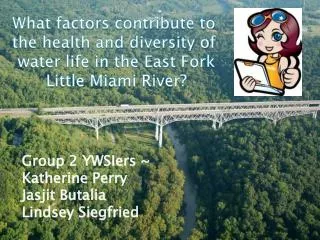
What factors contribute to the health and diversity of water life in the East Fork Little Miami River?. Group 2 YWSIers ~ Katherine Perry Jasjit Butalia Lindsey Siegfried. East Fork Little Miami Watershed . Covers 320,000 acres The East Fork State Park was formed in 1949

E N D
What factors contribute to the health and diversity of water life in the East Fork Little Miami River? Group 2 YWSIers ~Katherine PerryJasjit Butalia Lindsey Siegfried
East Fork Little Miami Watershed • Covers 320,000 acres • The East Fork State Park was formed in 1949 • Located in Clermont, Brown, Montgomery, Clark, Madison, Greene, Warren, Butler, Clinton, and Highland counties. • Some fish types are: Channel Catfish, Flathead Catfish, Rock Bass, Smallmouth Bass, and Spotted Bass.
Most land is: Agricultural Row crops Pasture/Hay But some is: Deciduous forest Commercial Industrial Transportation Low intensity residential Land use
Hypothesis #1 As the habitat around the stream improves, the macroinvertebrate population and diversity increases.
The Effect of Habitat on Macroinvertebrate Population Rating Scale Sample Location and Date
Hypothesis #2 If the substrate quality increases, then the fish diversity (IBI) will increase as well.
The Effect of Substrate Quality on Fish Diversity Sample Date and Location
Hypothesis 3 As the percentage of agricultural land use increases, the fish population and diversity will decrease.
The Effect of Agriculture on Fish Populations Percent Agriculture/IBI Rating Scale Sample Date and Location
Why the impact? • Meanders slow water speed and sediment drops into pools instead of riffles and runs where macroinvertebrates live. • A good substrate helps the fish survive by giving them place to hide, to lay their eggs, and for macroinvertebrates to live. • Agricultural land use negatively affects fish populations and diversity because organic waste given off by livestock, fertilizers and pesticides get carried into the stream by surface runoff.
How you can help • Conservation Reserve Program (CRP) • Encourage land owners to restore channelized streams and creeks. • Help in simple ways like throwing things in trash cans and recycling bins so that they don’t end up littering streams and creeks. • Only use chemicals when needed.
Katie Kim Shannon Leslie Megan Steve Thanks To… Ohio Supercomputer Center American Electric Power Battelle P&G Ingram White Castle Foundation The Ohio State University Paula Laura