Download
1 / 45
450 likes | 722 Vues
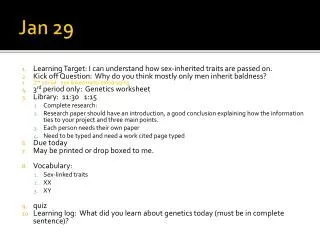
Schedule. Lectures Test Jan. 08, 09 Jan.15, 16 Jan. 22, 23 Jan. 29 Jan. 29, 30 Feb. 05, 06 Feb 12 Feb. 12, 13 Feb. 19, 20 Feb. 26, 27 March 12. Chromatography – Concepts and Contrasts by H. Millner. Modern HPLC for practicing scientist by Micheal W. Dong.

E N D
Schedule Lectures Test Jan. 08, 09 Jan.15, 16 Jan. 22, 23 Jan. 29 Jan. 29, 30 Feb. 05, 06 Feb 12 Feb. 12, 13 Feb. 19, 20 Feb. 26, 27 March 12
Chromatography – Concepts and Contrasts by H. Millner Modern HPLC for practicing scientist by Micheal W. Dong
Mechanism of Separation Terminology, Physical forces and their effect on separation, band broadening, resolution, optimization parameters
Definition “Separation is the hypothetical condition where there is complete isolation, by m separate macroscopic regions, of each of the m chemical components which comprise a mixture. In other words, the goal of any separation process is to isolate the m chemical components in their pure form in m separate vessels such as glass vials or polyethylene bottles”. Chromatography – Concepts and Contrasts by H. Millner Why is this hypothetical? Because it is theoretically impossible to accomplish complete separation of the components
In liquid-liquid extraction the extractant has a function similar to mobile phase. In distillation, the second phase (a vapor) is formed from the first phase (a liquid) as the liquid is heated. It is different from extraction and chromatography where a second phase is added. Much of the development of gas chromatography is based on the separations made by distillation (and fractional distillation). The concept of theoretical plates also originated from the distillation process. Field flow and electrophoresis employ a single phase and separations are effected via the second force such as voltage
In general all separation therefore depend on differential distribution of the analytes in the sample. • Different chemical states of the same matter for e.g. distillation • Different chemical phases i.e. absorption (partition), adsorption, liquid liquid extraction, solid phase extraction, supercritical fluid extraction, solid phase micro-extraction. • Different chemical environment like electrophoresis, dialysis, ultrafiltration
The analytes interacting most strongly with the stationary phase will take longer to pass through the system than those with weaker interactions. These interactions are usually chemical in nature, but in some cases physical interactions can also be used.
Column/Planar chromatography is basically a zonal or batch process as the sample is applied all at once as a narrow zone. If sample is applied continuously during the run it is termed as frontal analysis
Chromatography is a physical method of separation where components are distributed between two phases i.e. a stationary phase and a mobile phase As the mobile phase passes through the stationary phase components of the mixture interact and attain a equilibrium between the two phases leading to different migration rates through the system.
The process of establishment of equilibrium continues as molecules are absorbed and desorbed many times while passing through the stationary phase If sample components had undergone a large no. of sorption-desorption cycles the resulting peak shape will be Gaussian or symmetrical. Alternatively an asymmetrical or non gaussian peak shape indicates undesirable interaction between the sample and system components
Basic terminology and concepts of retention, selectivity, efficiency, resolution and peak tailing Mobile phase basics and parameter like solvent strength, pH, Ion pairing reagents, flow and temperature The resolution equation – effect of efficiency, retention and selectivity The van Deemeter equation – effect of particle size and flow rate Concepts in gradient analysis – peak capacity, effect of flow rate, gradient time etc.
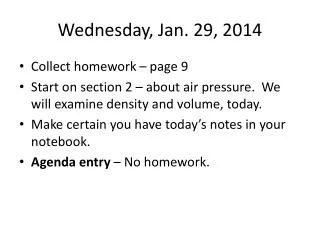
Wh Wb Inject • Typical response obtained by chromatography (i.e. a chromatogram): Chromatogram - concentration versus elution time Where: tR = retention time tM= void time Wb = baseline width of the peak in time units Wh = half-height width of the peak in time units
Peak width & peak position determine separation of peaks • The separation of solutes in chromatography depends mainly on two factors: • a difference in the retention of solutes (i.e., a difference in their time or volume of elution • a sufficiently narrow width of the solute peaks (i.e, good efficiency for the separation system) • A similar plot can be made in terms of elution volume instead of elution time. If volumes are used, the volume of the mobile phase that it takes to elute a peak off of the column is referred to as the retention volume (VR) and the amount of mobile phase that it takes to elute a non-retained component is referred to as the void volume (VM).
2) Solute Retention: A solute’s retention time or retention volume in chromatography is directly related to the strength of the solute’s interaction with the mobile and stationary phases. Retention on a given column pertain to the particulars of that system: - size of the column - flow rate of the mobile phase Capacity factor (k’): more universal measure of retention, determined from tR or VR. k’ = (tR –tM)/tM or k’ = (VR –VM)/VM Capacity factor is useful for comparing results obtained on different systems since it is independent on column length and flow-rate.
moles Astationary phase k’ = moles Amobile phase When k' is < 1.0, separation is poor When k' is > 30, separation is slow When k' is = 2-10, separation is optimum The value of the capacity factor is useful in understanding the retention mechanisms for a solute, since the fundamental definition of k’ is: k’ is directly related to the strength of the interaction between a solute with the stationary and mobile phases. Moles Astationary phase and moles Amobile phase represents the amount of solute present in each phase at equilibrium. Equilibrium is achieved or approached at the center of a chromatographic peak.
Wh 3) Efficiency: Efficiency is related experimentally to a solute’s peak width. - an efficient system will produce narrow peaks - narrow peaks smaller difference in interactions in order to separate two solutes Efficiency is related theoretically to the various kinetic processes that are involved in solute retention and transport in the column - determine the width or standard deviation (s) of peaks Estimatesfrom peak widths, assuming Gaussian shaped peak: Wb = 4s Wh= 2.354s Dependent on the amount of time that a solute spends in the column (k’ or tR)
Number of theoretical plates (N): compares efficiencies of a system for solutes that have different retention times N = (tR/s)2 or for a Gaussian shaped peak N = 16 (tR/Wb)2 N = 5.54 (tR/Wh)2 The larger the value of N is for a column, the better the column will be able to separate two compounds. - the better the ability to resolve solutes that have small differences in retention - N is independent of solute retention - N is dependent on the length of the column
Plate height or height equivalent of a theoretical plate (H or HETP): compare efficiencies of columns with different lengths: H = L/N where: L = column length N = number of theoretical plates for the column H simply gives the length of the column that corresponds to one theoretical plate H can be also used to relate various chromatographic parameters (e.g., flow rate, particle size, etc.) to the kinetic processes that give rise to peak broadening: Why Do Bands Spread? a. Eddy diffusion b. Mobile phase mass transfer c. Stagnant mobile phase mass transfer d. Stationary phase mass transfer e. Longitudinal diffusion
Longer path arrives at end of column after (1). a) Eddy diffusion– a process that leads to peak (band) broadening due to the presence of multiple flow paths through a packed column. As solute molecules travel through the column, some arrive at the end sooner then others simply due to the different path traveled around the support particles in the column that result in different travel distances.
b) Mobile phase mass transfer– a process of peak broadening caused by the presence of different flow profile within channels or between particles of the support in the column. A solute in the center of the channel moves more quickly than solute at the edges, it will tend to reach the end of the channel first leading to band-broadening The degree of band-broadening due to eddy diffusion and mobile phase mass transfer depends mainly on: 1) the size of the packing material 2) the diffusion rate of the solute
c) Stagnant mobile phase mass transfer– band-broadening due to differences in the rate of diffusion of the solute molecules between the mobile phase outside the pores of the support (flowing mobile phase) to the mobile phase within the pores of the support (stagnant mobile phase). Since a solute does not travel down the column when it is in the stagnant mobile phase, it spends a longer time in the column than solute that remains in the flowing mobile phase. The degree of band-broadening due to stagnant mobile phase mass transfer depends on: 1) the size, shape and pore structure of the packing material 2) the diffusion and retention of the solute 3) the flow-rate of the solute through the column
d) Stationary phase mass transfer–band-broadening due to the movement of solute between the stagnant phase and the stationary phase. Since different solute molecules spend different lengths of time in the stationary phase, they also spend different amounts of time on the column, giving rise to band-broadening. The degree of band-broadening due to stationary phase mass transfer depends on: 1) the retention and diffusion of the solute 2) the flow-rate of the solute through the column 3) the kinetics of interaction between the solute and the stationary phase
e) Longitudinal diffusion– band-broadening due to the diffusion of the solute along the length of the column in the flowing mobile phase. The degree of band-broadening due to longitudinal diffusion depends on: 1) the diffusion of the solute 2) the flow-rate of the solute through the column
Van Deemter equation: relates flow-rate or linear velocity to H: H = A + B/m + Cm where: m = linear velocity (flow-rate x Vm/L) H = total plate height of the column A = constant representing eddy diffusion & mobile phase mass transfer B = constant representing longitudinal diffusion C = constant representing stagnant mobile phase & stationary phase mass transfer One use of plate height (H) is to relate these kinetic process to band broadening to a parameter of the chromatographic system (e.g., flow-rate). This relationship is used to predict what the resulting effect would be of varying this parameter on the overall efficiency of the chromatographic system. Number of theoretical plates(N)(N) = 5.54 (tR/Wh)2peak width (Wh) H = L/N
moptimum Plot of van Deemter equation shows how H changes with the linear velocity (flow-rate) of the mobile phase Optimum linear velocity (mopt) - where H has a minimum value and the point of maximum column efficiency: mopt = rB/C moptis easy to achieve for gas chromatography, but is usually too small for liquid chromatography requiring flow-rates higher than optimal to separate compounds
4) Measures of Solute Separation: Separation factor (a) – parameter used to describe how well two solutes are separated by a chromatographic system: a = k’2/k’1 k’ = (tR –tM)/tM where: k’1 = the capacity factor of the first solute k’2 = the capacity factor of the second solute A value of a > 1.0 is usually indicative of a good separation Does not consider the effect of column efficiency or peak widths, only retention.
tr2 – tr1 (Wb2 + Wb1)/2 Resolution (RS) – resolution between two peaks is a second measure of how well two peaks are separated: RS = where: tr1, Wb1 = retention time and baseline width for the first eluting peak tr2, Wb2 = retention time and baseline width for the second eluting peak Rs is preferred over a (separation factor) since both retention (tr) and column efficiency (Wb) are considered in defining peak separation. Rs 1.5 represents baseline resolution, or complete separation of two neighboring solutes ideal case. Rs 1.0 considered adequate for most separations.
Peak symmetry: Asymmetry (As) and Tailing factor (Tf) Ideally the chromatographic peaks should have gaussian shapes with perfect symmetry but in reality most peaks are asymmetrical and show fronting or tailing effect. Asymmetry factor is defined at peak width equivalent to 10% of the peak height Tailing factor is defined at peak width equivalent to 5% of the peak height
The total volume in the column VT is made up of three parts VT = Vss+ VS +VM Where Vss = Volume occupied by the solid support VS = Volume occupied by the stationary phase VM = Volume occupied by the mobile phase
If the solid is non porous then VM is the inter-particle volume. If the solid is porous it includes both the inter-particle volume and the internal volume. The pores of the particles may not allow some of the analyte molecules . This gives rise to two definitions of porosity. The total porosity eTwhichis the fraction of void space in the column eT = VM/VT For very tightly packed columns with small particles porosity can be as high as 0.80-0.84 for a porous material, In other words even a tightly packed bed of porous particles is still about 80% empty
The other measure of porosity is only that fraction of volume which is present between the particles e1 = Inter particle volume /VT It varies with the tightness of packing and has a typical value of 0.40-0.45. Non-porous particles have only one porosity.
Characteristics of column packing Silica Organic Polymers Packing may be spherical or irregular in shape. Spherical ones are most commonly used in HPLC Porous packing e.g. Silica gel Non-porous packing e.g. Glass beads For HPLC of biomolecules pore size should be > 30nm
Characteristics of Silica The most widely used support medium is silica. It has also been used for size exclusion chromatography and for many chemically modified bonded phase materials. Silica has: • Free silanol groups which are slightly acidic and as such basic compounds may adsorb at these sites giving rise to chemical interactions. • Geminal silanol groups which are not acidic. • Vicinal silanol groups are not acidic and usually compound with OH groups tend to interact at these sites.
Silanol groups present near metal cations are strongly acidic and are responsible for increasing the heterogeneity of the surface which in turn can badly affect the separation of basic compounds Siloxanes are formed from vicinal silanols. Heat treatment of the silica increases the amount of siloxanes and decreases the silanol concentration.
Bonded Phase Silica and its stability The silanol groups of the silica can be modified chemically (amino, nitro, nitrile octadecyl, trimethyl phenyl, diphenyl ….etc.) to give stationary phase with specific properties. The bonded stationary phases are normally stable in the absence of metals. The bonded phases are less stable at high pH and temperature. Also inorganic buffers such as phosphates or carbonates should normally be avoided
Other stationary phases include Alumina Magnesium Silicates Controlled-Pore Glass Hydroxyalkyl methacrylate Hydroxyapatite Agarose Porous Graphite carbon Zirconia Restricted Surface Access Phases
Mobile phases Characteristics Will depend on the type of stationary phase and compounds being separated