Download
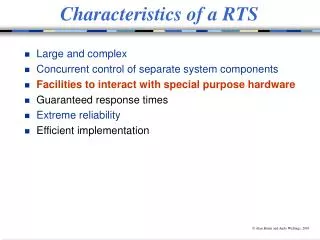
1 / 42
420 likes | 629 Vues
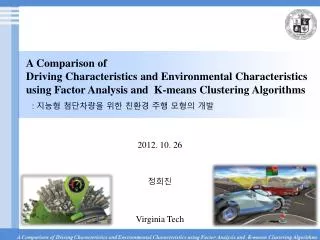
A Comparison of Driving Characteristics and Environmental Characteristics using Factor Analysis and K-means Clustering Algorithms. : 지능형 첨단차량을 위한 친환경 주행 모형의 개발. 2012. 10. 26. 정희진. Virginia Tech. Table of Contents. Introduction Study 1 Study 2 Study 3 Conclusion and Further Study.

E N D
A Comparison of Driving Characteristics and Environmental Characteristics using Factor Analysis and K-means Clustering Algorithms : 지능형 첨단차량을 위한 친환경 주행 모형의 개발 2012. 10. 26 정희진 Virginia Tech
Table of Contents Introduction Study 1 Study 2 Study 3 Conclusion and Further Study
Introduction: 연구 배경 • 첨단 기술의 발달로 과거와 달리 운전자의 행동에 직접적으로 영향을 줄 수 있는 잠재적 가능성이 높아짐. Intelligent Vehicle 지능형 첨단 차량 Driving Assistance Systems 충돌 예방 경보 시스템
Introduction: 연구 배경 • 첨단 교통 시스템 분야에서 운전자의 행동과 자동차 제어 전략의 변화의 환경적 영향에 관심이 높음 Eco-driving assistance Systems 경제적 환경적 주행 보조 시스템 Eco-driving의 개념은 운전자의 주행 거동의 변화를 통해 연료소모를 최소하는 것임
Introduction: 연구 배경 Eco-driving 기대 편익 Environ-mental Safety 도로 안전의 강화 온실가스 감축 대기 오염물질의 감축 소음 감소 운전기술의 강화 차량 유지 보수 비용 저감 운전자 및 탑승객 승차감 향상 Financial Social 연료 소모량 감소 더욱 책임감 있는 주행 사고 비용 감소 주행 중 스트레스 감소
Introduction: 연구 배경 차량 종류 엔진 온도 구배 연료 소모량 배기가스 배출량 주행 습관 차량 무게 노면 상태 유지 관리 차량 연식
Introduction: 연구 배경 주요 연구 내용 • 본 연구의 목표는 eco-driving을 모형화를 위해 개별 운전자의 주행 특성과 환경 특성을 분석하여 이상적인 주행 형태를 찾는 것임 이상적 주행행태 도출을 통한 Eco-driving 구현 동일 교통류 상의 개별 차량 간 배기가스 배출량과 연료소모량의 차이 분석 Task 1 개별 운전자의 가감속도 차이에 따른 배기가스 배출량과 연료 소모량을 비교 Task 2 운전자의 유형 차이에 따른 주행 및 환경 영향 특성을 비교 Task 3
Introduction: 전체 연구 흐름도 Trajectory Data 분석 및 처리 Microscopic emissions model을 이용한 연료소모량 및 배기가스 배출량 산정 Study 1: 배기가스 배출량 및 연료 소모량 비교 Study 2: aggressivity기반의 운전자 분류와 운전자 그룹의 배기가스 및 연료소모량 비교 Study 3: 주행 특성 기반 분류와 환경 영향 기반 분류의 비교 및 상관성 연구
Introduction: Trajectory 데이터 NGSIM trajectory data • Used NGSIM trajectory data sponsored by FHWA (Next Generation Simulation Program. • The data was collected every deci-second for 15 minutes, and then converted to trajectory data including 18 items. • The site where data was collected is a segment of I-80 including 6 main stream lanes of 1650 ft and 1 on-ramp of 140 ft. • The data was collected three times on April 13, 2005:
Introduction: Trajectory 데이터 NGSIM trajectory data 7 digital cameras 영상 처리 알고리즘을 이용한 분석 각 차량의 궤적 데이터 구성 속도와 가속도 선행 및 후행차량 인식 Time/distance headway와 상대속도 18 개 항목으로 구성된 trajectory data 구축 segment of I-80
Introduction: 연료소모량 및 배기가스 배출량 산정 Microscopic Energy and Emissions Models • VT-Micro for first and second studies For accelerating (equation1): For braking (equation 2): • Comprehensive Modal Emissions Model(CMEM) for third study
Study 1 연구 흐름도 Smoothing 속도 프로파일 데이터 VT-Micro Model을 이용한 연료소모량 및 배기가스 배출량 산정 Percentile 분석 배기 가스 배출량 및 연료 소모량 비교
Study 1 연료 소모량 및 배기가스 배출량 예측 • VT-Micro model 사용 • 정체 정도에 따라 3 개의 데이터 셋 사용. • 예측은 다음과 같은 전제에서 수행됨 • 모든 차량은 같은 연식 같은 타입의 승용차로 구성 • 각 차량의 차이는 속도 프로파일에 의해서만 정의됨 Percentile 분석 • 예측된 연료 소모량 및 배기가스 배출량을 기준으로 순서대로 재 배열 • 순서대로 100 개의 percentile로 균등 분배 • 각 percentile내의 차량 중 가장 많은 연료를 소모했거나 가장 많은 특정 배기가스를 배출한 차량을 대표차량으로 선정 • 각 percentile의 대표차량의 연료소모량 과 배기가스 배출량을 비교
Study 1 검증 1: 비정체 상황에서 High emitters • Percent of fuel consumption and emissions for different percentile of vehicles in non-congestion condition.
Study 1 검증 2: 정체 상황에서
Study 1 • 비정체, 정체 모든 상황에서 약 15%의 차량 percentile에 해당하는 차량들이 다른 차량에 비해 최대 300%의 많은 배기가스를 배출하였다. • 연료소량은 배기가스 배출량에 비해 차이는 적었으나 약 5%의 차량 percentile이 약 두배의 연료를 소모하였다. • 그러므로, 동일 교통류에서 배기가스 배출량과 연료소모량이 많은 주행 특성을 가지는 차량이 존재한다. 결론
Study 2 연구 흐름도 가속도 프로파일 데이터 처리 Phase 분석을 통한 target operating acceleration modeling Target operating acceleration을 이용한 운전자 분류 운전자 그룹별 배기가스 및 연료 소모량 비교 운전자 주행 특성 변화에 의한 배기가스 배출량 및 연료소모량 개선 효과 분석
Study 2 Concept of the Five Processes o Acceleration Data Target operating Acceleration Accelerating Process Recovery A o o o o o o Braking Recovery B o o o o o o 0 o o o o o o o o o Constant Speed (Zero Acceleration) Target operating Acceleration
Study 2 Separating Processes Algorithm Where, Acc is acceleration, and dAcc/dt is variation of acceleration
Study 2 Phasing 된 가속도 프로파일 데이터와 target operating acceleration의 예 • Time versus acceleration diagram for an example recognized process and its target operating acceleration.
Study 2 분류 방법
Study 2 Average Target Operating Acceleration and Brake • Mean and standard deviation of operating acceleration and brake Variables • Where, Daccel,i and Dbrake, i are the differences in average operating acceleration and brake of ith vehicle from the mean of average operating acceleration of all vehicles respectively. Ai and Bi are the average operating acceleration and brake of ith vehicle respectively, and Aavg and Bavg are the mean of average operating acceleration and brake of all vehicles under consideration.
Study 2 Results of Classification
Study 2 Results of Classification Number of vehicles in each class
Study 2 Evaluation of emissions and fuel consumption 14.770 70.57 14.67 13.81 71.99 14.20 21.52 66.04 12.44 23.40 64.98 11.63 20.40 67.39 12.22 14.810 69.44 15.74 13.20 69.60 17.20 19.08 65.59 15.33 21.60 64.28 14.12 19.79 66.14 14.07 13.580 72.12 14.30 11.47 73.39 15.14 16.01 69.91 14.06 18.63 68.26 13.12 17.69 69.24 13.07 Results of fuel consumption and emissions in each condition. Note: 1: number of vehicles, 2: Fuel Consumption 3: HC, 4: CO, and 5: Nox the numbers on bar: rates in percentage
Study 2 Estimation of impact of driving behavior changes Considered two alternative scenarios. Alternative 1 • All aggressive drivers changed their driving behaviors to moderate drivers Alternative 2 • All aggressive and moderate drivers changed their driving behaviors to defensive drivers
Study 2 Results of estimations Note: Alternative 1: Aggressive drivers change to moderate drivers, and Alternative 2: Aggressive and Moderate drivers change to defensive drivers.
Study 2 Results of estimations • alternative 1에 비해 alternative 2에서 개선 효과가 더 기대됨 • 비 정체상황에서 Alternative 1의 경우 CO, HC, and NOx각각 9.8%, 7.7%, and 6.3 % 감소하였음. • 비 정체상황에서 Alternative 2의 경우CO, HC, and NOx각각 20.8%, 15.1%, and 16.7% 감소하였음. • 정체 상황에서 연료소모량과 분류된 운전자 그룹간의 상관관계는 발견되지 않았음. • 모든 교통 상황에서 배기가스 배출량과 운전자 그룹간의 상관관계가 발견되었음. Summary of Findings • 차량의 속도특성이 연료 소모량의 주요인으로 추측됨. • 제안된 average target operating acceleration은 배기가스 배출량의 차이의 주요인으로 간주될 수 있음. • 비정체 상황 보다는 정체상황에서 배기가스 배출량의 감소효과가 더 기대됨. • 운전자 교육 및 홍보를 통해 aggressive 운전자의 주행 습관을 변화시킨다면 배기가스의 유의미한 감소를 기대할 수 있음.
Study 3 연구 흐름도 Driving data 구성 Environmental data 구성 Factor Analysis Factor Analysis Cluster 수 결정 Cluster 수 결정 Driving Clustering Environmental Clustering Mapping
Study 3 Driving Data 5 Selected variables were converted to 10 variables from the trajectory data
Study 3 Factor analysis of Driving Data Results of Factor Analysis of Driving Data
Study 3 Results of driving clustering 공간 기반 운전자 그룹 (Spacing-based drivers group) Macroscopic factor Moderate group 속도 기반 운전자 그룹 (Speed-based drivers group) microscopic Factor
Study 3 Definition of clusters cluster 2의 속도 기반 운전자 그룹 상대적으로 큰 Microscopic factor 값을 가진 운전자 그룹. cluster 1의 공간 기반 운전자 그룹 상대적으로 큰 Macroscopic factor 값을 가진 운전자 그룹. cluster 3의 Moderate 운전자 그룹 두 factor 값 모두 작은 값을 가진 운전자 그룹
Study 3 Environmental Data CMEM을 이용하여 예측한 배기가스 배출량과 연료소모량 • Descriptive statistics of variables as emissions and fuel consumption
Study 3 Factor analysis of Environmental Data
Study 3 Results of Environmental clustering Fuel Consumption Factor High emitters group Moderate emitters group Incomplete Combustion Factor
Study 3 Comparative Analysis of Emissions and Energy
Study 3 Mapping Moderate drivers Speed based drivers spacing based drivers Speed-based Drivers group Moderate drivers group Spacing-based Drivers group Comparative analysis between (a) driving clustering and (b) environmental clustering on the incomplete combustion factor versus fuel consumption space.
Study 3 • 앞에서 제시한 전제에 근거해 약 75% 운전자들은 두 분류 방법에서 일치 되게 분류됨. • 공간 기반 운전자들은 적은 양의 배기가스를 배출하였으나 상대적으로 많은 양의 연료를 소모하는 High energy consumers’ group으로 분류 될 수 있음. • 반면, 속도 기반 운전자는 같은 연료 소모 성향을 가진 운전자들 중에 상대적으로 많은 배기가스를 배출하는 high emitters’ group으로 분류할 수 있음. • 대부분의 moderate 운전자들은 그렇지 않은 운전자들에 비해 적은 배기가스 및 연료를 소모하는 성량이 있음. Summary of Findings
Conclusion • Significant factors for driving clustering and environmental clustering was found. • While the high error rate (25%), the relationship between driving clustering and environmental clustering is significant. • A potential to estimate emissions and fuel consumption based on driving clustering is found. • The moderate drivers’ group should be similar to the eco-drivers. • Changing driving behavior to moderate drivers is recommended.
Further Study • 본 연구의 study 3에서 돌출된 결론인 정체상황 하에서도 유효한지에 대한 추가 연구가 필요함. • 비선형 classification algorithm을 사용하여 보다 정교하고 확고한 분류를 수행할 필요가 있음. • 운전자의 주행 특성을 보다 잘 반영할 수 있는 추가적인 변수의 개발이 필요함. • Eco-driving의 모형화 및 평가 모델의 개발이 필요함. • 운전자의 주행 환경을 반영한 eco-driving 모형의 개발이 필요함.