Understanding Comparative Advantage and Trade through Production Possibilities Curve Analysis
100 likes | 229 Vues
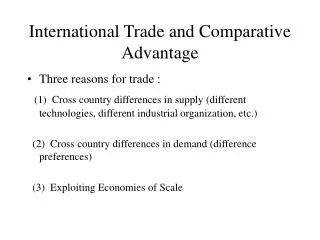
This analysis explores the concept of comparative advantage and trade by examining Production Possibilities Curves (PPC) for chocolate bars and packs of gum. It delves into slope calculations, opportunity costs for producing each item, and the area under the curve. We will also assess the absolute and comparative advantages between two hypothetical countries, analyzing their production capabilities and the effects of trade. By illustrating the PPCs and understanding resource allocation, we highlight the significance of international trade and specialization.

Understanding Comparative Advantage and Trade through Production Possibilities Curve Analysis
E N D
Presentation Transcript
Comparative Advantage and Trade Why do economies trade?
Answer the Following: • What is the slope of the curve? • What is the opportunity cost of producing a pack of gum? • What is the opportunity cost of producing a chocolate bar? • Calculate the area under the curve.
Production Possibilities Curve Chocolate Bars 12 PPC 0 15 Packs of Gum
Answer the Following: • What is the slope of the curve? • What is the opportunity cost of producing a pack of gum? • What is the opportunity cost of producing a chocolate bar? • Calculate the area under the curve. -4/5 -4/5 of a chocolate bar -1.25 packs of gum 90 units
Production Possibilities Curve Chocolate Bars 12 10 PPCA PPCB 0 4 15 Packs of Gum
Who has absolute advantage? Which country can make more? Country A has absolute advantage in both gum and chocolate
Who has comparative advantage? How do the opportunity costs compare for both countries? Country A has comparative advantage in gum Country B has comparative advantage in chocolate
Work Together… Values represent all resources spent on one good (the other value is 0) • Draw the PPCs for both states • Who has absolute advantage? • Who has comparative advantage? • What happens to production and consumption when Oregon and Washington trade 20 apples for 20 timber?