Download
1 / 33
340 likes | 404 Vues
Explore the intricate relationship between chemical properties and environmental impact through experiments on bioaccumulation and toxicity. Delve into physical chemistry concepts and learn about fugacity, activity, and the influence of solubility on toxicity assessments.

E N D
Chemical concentration, activity, fugacity, and toxicity Don Mackay and Jon Arnot Trent University McKim Conference Duluth, MN September, 2007
Outline • A refresher of some physical chemistry • Four chemicals, log KOW = 2, 4, 6, 8 • Two organisms, fish and mammal • Bioaccumulation “experiments” • Toxicity “experiments” • Concluding thoughts • Part II by Jon Arnot (Thursday am)
Some physical chemistry of organic liquid solutes in dilute solutions Raoult P = x PSL (ideal) Raoult P = x PSL (non-ideal) Dalton P = y PT so P = x PSL =y PT
Rigorous fugacity version f = x fR = y PT reduces to P = x PSL =y PT when f = P, fR = PSL , = 1 f and P are “escaping pressures” Pa
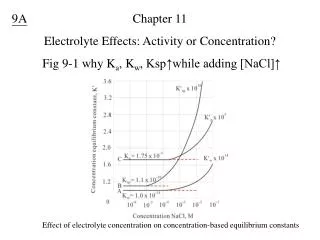
Air 1 2 Two immiscible liquids and a gas phase in equilibrium, liquid solute. P f = x11PSL =x22PSL = yPT x11=x22= yPT / PSL= P / PSL = activity Saturation or solubility occurs when activity=1.0 Solubility is a measure of the activity coeff.
Equilibrium criteria P or f or activity Partition coefficients KA1, KA2, K12 can be expressed using x1, x2,y or C1, C2, CA g/m3 e.g., KAW, KOW, KOA Depend on 1, 2 and PSL Can give ratios of 1/ 2 Relate C to f using C = Zf, Z is a “fugacity capacity” Useful if solvent is complex, e.g., fish Z = 1/(PSL) CAIR=ZAIR f C1= Z1 f C2 = Z2 f K12=Z1/Z2
Critical Point Atmospheric Pressure Gas Pressure Liquid Vapor Pressure Solid Vapor Supercooled Liquid Vapor Pressure PSL Liquid Fugacity Ratio F = PSS/PSL Vapor Triple Point » Melting Point Solid Vapor Pressure PSS Temperature Boiling Point What if the solute is solid or gaseous?
How do we treat solid or gaseous solutes? The solute is in the liquid state and “thinks” it is a liquid so it behaves according to PSL We must “correct” using F for solids For gases we lump PSL as H, Henry’s Law constant
If molar mass is large (and especially if the molecule is symmetrical) Melting point is high i.e., >> 25oC F is low, e.g., 0.1 to 0.001 PSS << PSL SSS << SSL F = PSS / PSL = SSS / SSL Solubility xS can be used to estimate Liquids xS = 1 Solids xS = F Be wary of reported PS and SS of solids! QSARs and retention time methods give PSL andSSL
Four chemicals A, B, C and D log KOW = 2, 4, 6, 8 Define MW, melting point, octanol , vapor pressure Deduce water, solubility, KAW, KOAfor both liquid and solid states
Two organisms 100 g fish, 10% lipid 100 g mammal, 10% lipid Respiration and feeding rates lipid = octanol No metabolic biotransformation
Metabolic biotransformation; kM Respiratory exchange; k1and k2 20% NLOM 70% water Growth dilution; kG 10% lipid Fecal egestion; kE Dietary intake; kD Two organisms – same properties and processes NLOM equivalent to 3.5% lipid
Bioconcentration “experiment” CWater = 1 g.m-3 of each chemical air is in equilibrium, so CAir = 0.009 to 0.003g.m-3 depending on KAW
Fish BCF 0.1 KOW L.KOW Hamelink, Neely, Veith, Mackay
Why is the empirical slope < 1? • Insufficient time for equilibration ? • Bioavailability ? • KOW overestimated by QSARs ? • Water and NLOM partitioning at low KOW ? • Lipid Octanol ? • Biotransformation and growth ? • Other ?
Toxicity “experiment” Assume toxic effect at 3 mmol.kg-1 or 3 mol.m-3 i.e. narcosis What are the water and air concentrations required to cause toxicity? Essentially a “backward” bioconcentration experiment
Concentration vs activity vs fugacity Concentrations and fugacities vary by about six orders of magnitude Activities vary relatively little (factor of 3) The system is striving for equi-fugacity, externally and internally.
Some conclusions and points for discussion • Bioconcentration in fish from water and mammals from air is well understood using KOW and KOA • Narcosis is well characterized by 3 mol.m-3 factor of 2 • Uptake times can be long and can exceed short term test duration • Solubility of solids can limit partitioning and toxicity • Don’t use exposure concentrations > solubility: meaningless results! • Biotransformation, dynamics and growth are important. • Challenges of “selective” toxics: we have to get the “simple” narcosis model right first. Then we use this as a basis for developing more rational and effective methods of modeling toxicity of more challenging substances and eliminating unnecessary (but not all) animal testing.
QSARs and 5 D’s Toxicity depends on: • Delivery to organism, i.e., Corg/Cenv • Distribution in organism (toxicokinetics) • Disruption (biochemical) • Dynamics and efficiency of uptake • Degradation of chemical in organism (biotransformation) as well as KOW Is a general QSAR for toxicity attempting too much? Categories? Perhaps a set of QSARs yielding parameters that can be combined using a model?