3D CITY CARTOGRAPHIC MODELS
420 likes | 570 Vues
3D CITY CARTOGRAPHIC MODELS. Temenoujka Bandrova. Department of Photogrammetry and Cartography University of ACEG – Sofia bandrova_fgs@uacg.bg. IN BRIEF. Users of 3D maps 3D map – definition and content (main, secondary and additional cont.)

3D CITY CARTOGRAPHIC MODELS
E N D
Presentation Transcript
3D CITY CARTOGRAPHIC MODELS • Temenoujka Bandrova Department of Photogrammetry and Cartography University of ACEG – Sofia bandrova_fgs@uacg.bg
IN BRIEF • Users of 3D maps • 3D map – definition and content (main, secondary and additional cont.) • “From Paper to Virtual Map”– а cheap technology for easy creation of 3D maps • 3D cartographic symbol system • Animation of 3D maps
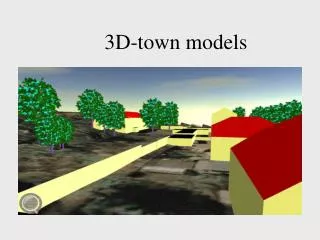
3D maps – USERS • City planning and architecture 3D modelling of а part of Varna city in Bulgaria by DavGeo Ltd.
3D maps –created for different usage • Education in schools and universities
3D maps –created for different usage • Land use 3D modelling of а part of Varna city in Bulgaria by DavGeo Ltd.
3D maps –created for different usage • Land management and cadastre
3D maps –created for different usage • Telecommunications • Design and advertisement
3D maps –created for different usage • Tourist offices • Archives of City Architecture
3D maps –created for different usage • Transport services
3D maps –created for different usage • Crises management 3D model of New York (http://www.metroblocks.com)
3D maps –created for different usage • Police • Military • fire management
3D maps –created for different usage • Meteorology
3D maps –created for different usage • Environment pollution • Water resources • Flood mapping • Crises management • Risks Prevention Plans • Long-term Monitoring • Flood early warning 3D model created by Institute of Planetary Exploration, DLR
map - definition • Maps– cartographic products represent the spatial variety of the natural and socio-economic phenomena. • 2 aspects: - mathematical – scale, map projections, co-ordinate system - geographical – visualize geo-information
3D map - definition • Digital, mathematical defined, three-dimensional virtual representation of the Earth surface, objects and phenomena in nature and society. Represented objects and phenomena are classified, designed and visualised according to a particular purpose.
Disadvantages of 3D maps • Higher hardware and software requirements • Difficulties in 3rd coordinate collection • Large amounts of data and complex visualization • Lack of standardized symbol system • High 3D production price
Advantages of 3D maps • Multiple geometric representation • High realistic representation of the real world • Photo-realistic buildings and objects representation • User friendly and easy for understanding models • Attractive and more informatively products • More applications and users
Contents of 3D maps • Main content • Secondary content • Additional content
Main content • large topographic or landscape objects – relief bodies • roads • buildings
Secondary content • information signs • trees • geodetic points • traffic signs • facilities • transport elements 3D map “a street in Vienna”, created by ICG, TUGraz and 3D symbols created by T. Bandrova
Additional content • quality and quantity information about objects – fence, roof, street, parcel • created as a textural database
Sources for 3D map • paper topographic or cadastral maps • photogrammetric or surveying data • digital 2D map • topographic information, measurements, architecture drawings etc. • digital or paper photos • 3D symbol system
Mathematical basis Y (forefinger) X (thumb) Z (palm) + • Scale – source 2D paper or digital map • 2D view in “top”, “front”, “left”, …. • Perspective projection • Spatial orthogonal 3D co-ordinate system ХYZ (local)
Code Name of type object object Classification of mapping objects 1000 1100 1110 1120 1130 1131 1132 1133 1140 --- 1500 1510 1520 1521 --- 1527 --- 2000 --- 3000 --- 4000 --- Situation Geodetic base Astronomic point Triangulation point Polygon point (PP) PP, stabilized by a wooden picket PP, stabilized by a concrete block PP, stabilized by an iron tube Axis point Transport objects Railway Roads Highway Shaped pathway Hydrographic objects Relief Pipelines … The basic types, kinds and sub-kinds objects - hierarchy-code presentation European standards for exchange of information
Generalization Automatic – formal selection, smooth and filtration, according formal criteria Dynamic – for animation presentation and track out the development of the phenomena in the space and time Interactive – complex of the traditional, automatic and time generalization
Accuracy in objects representation Accuracy in reference (location) Thematic accuracy Semantic accuracy
Accuracy in object location • accuracy of measurements and data capture • scale of 2D map • - method of sources processing
Thematic accuracy • data base – quality of statistical data, methods of capture and processing • data transformation – selection, classification and data references
Semantic accuracy • symbols define the objects • realistic and informatively representations
Photo-texturing Photos from street level – for buildings facades
Photo-texturing textures after image processing
Texturing Software library texturing - areas symbols Grass Pavements Roads
Preparation of Sources for Map Creation Converting of Sources in Digital Form Including Third Coordinates Reconstruction of Digital Terrain Model (DTM) Designing of Main Content (buildings, streets etc.) 3D Symbolization of the 3D Map Preparation of Photo textures Photo-Realistic Visualization of 3D Map A technology for designing of 3D maps
3D maps on 2D monitor? This disadvantage is overtaken by applying of various “tricks” just in order to leave the user with no doubt that it is rally a 3D model. This can be enriched by assigning to the objects of properties of the real objects and materials, such as luminosity, roughness, transparency, lighting, shadow. 3D maps become more realistic like in the real world.
Quality of visualizing of 3D maps • Real color tone of screen points • Good contrast and focus • Maximum possibility for brightness usage and keeping of good contrast • Grey linear scale (proportional brightness levels) • Quality of the white color • Monitor’s flicker and twinkle
Steps for symbol creation • gathering information for an object; • analyzing information and collecting data for each object; • designing symbols by visual and metric analysis applying computer graphics techniques; • visualizing symbols in virtual environment; • obtaining synthesized information for an object.
3D map Central Sofia 43 buildings, streets, pavements, grass areas, symbol system; 24 photos, scanning with 300 dpi, в RGB (Type: Sharp Millions of Color, Brightness: 125, Contrast: 132) 5 photo-textured buildings
3D map - Vienna 3D model of 28 buildings GIS data Aero-photosand photos of buildings’ facades, made from street level Scanning of 200 traffic signsfor texture processing
Conclusions • Creation of a symbol system will facilitate the compilers as well as users of 3D maps. • Their existing will legalize the 3D maps and this is the task of cartography in nowadays. • The next step - researches of the qualitative and quantitative features of the map by 3D GIS, extraction of the data for it and solving of different kind of tasks.
Thank you very much for your attention! Temenoujka Bandrova bandrova_fgs@uacg.bg University of Architecture, Civil Engineering and Geodesy Sofia - Bulgaria