Download
1 / 18
180 likes | 200 Vues
Explore the structure, dynamics, and lifecycle stages of R&D partnerships. Discover models for creating, maintaining, transforming, and exiting collaborations through ethnographic, statistical, and visual analyses.

E N D
Partnership Lifecycles and the Evolution of Collaborative Relationships Robert T. Trotter, II Northern Arizona University, Flagstaff, AZ Society for Applied Anthropology March 31-April 4, 2004
Project Goals Understand the structure and dynamics of R&D collaborative partnerships and develop models for creating, sustaining, transforming, and exiting partnerships Survey Project Sub-Goals • Identify the network structure of collaborative ventures (integration, action structures, barriers) • Identify the dynamics of collaborative systems (roles, key linkages, central players, communication processes, changes through time) • Create a structural and role based model for ideal initiation, maintenance, renewal, change or exit
Acknowledgements: The Team • Elizabeth Briody • Gulcin Sengir • Linda Catlin • Tracy Meerwarth • Devedatta Kulkarni
Basic Methods • Data collection • Interviews (N=88) • Focus groups (N=10) • Direct observation • Document analysis • Social-network survey (N=173)
Analysis Overview • Ethnographic Analysis • Partnership models, descriptions and trends • Partnership dynamics • Partnership profiles • Sociometric Analysis • Statistical analysis of network characteristics • Sociometric analysis of structure, roles, positions • Network visualization and hypotheses generation
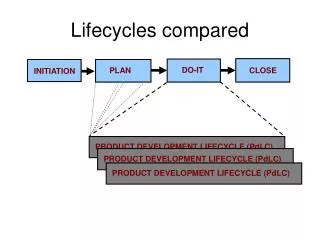
The Life Cycle of Collaboration: Results from the Ethnography • Primary Stages: Partnership structures and the dynamic relationships that drive successful collaborations follow a clear lifecycle pattern. • Initiation Stage • Courtship Stage • Start-Up Stage • Mid-Term Stage • Mature Stage • Transition Stage
Qualitative Evidence for Evolution:Changes over Time • Size and Composition • Gradual addition of both roles and individual expertise on both sides • Individual roles evolve • More roles are added • Increase in complexity of roles • Specific roles accumulate duties and obligations
Qualitative Evidence (cont.) • Initiation and Courtship • Ladder model • Agreeing on technical issues • Identifying and beginning mutual interests • Mid-Term • Developing relationships • Maturity • Getting work done • Transition • Determining the Future
Network Survey Evidence • The network survey allowed us to explore four of the six stages of the partnership life cycle in detail • Sample Information Table 1. Response Rates and Total Responses to Network Survey vey Partner E.Coast Univ. GM- Mid Atlantic GM- Midwest Univ. GM- W.Coast Univ. GM- Row MidAtl. E.Coast Midwest W.Coast T o tals Surveys 15 7 34 14 39 20 32 15 286 Sent Surveys 10 7 15 7 22 16 22 11 173 Returned Percent 66.7 100.0 44.1 50.0 56.4 80.0 68.8 73.3 60.5 Returned
Network Survey Evidence • Analysis Process • Freelisting – Salient Positions and Roles (Anthropac) • Edgelists were used to create sociometric matrices • Sociometric Analysis was conducted
Evolution through Network Through Statistical Trends and Visualization • Statistical Trends • Network Visualization Processes
Statistical Trends • The statistical trends that support our evolutionary hypothesis include: • Changes in size of whole network, average personal network, and complexity of network were observed.(e.g., increasing in number of participants as partnership ages) • Changes in sociometric measures (overall network density, transitivity, number of components, etc.) (e.g., newer partnerships have a lower average distance and higher density)
Network Visualization Hypotheses and Data from the Survey • The data was assumed to match with specific stages in the partnership cycle • Hypothetical and real networks were analyzed for similar structures
Network Visualization Data: KineMage Images of Start Up
Network Visualization Data: KineMage Images of Mid-Stage
Network Visualization: KineMage Image of Mature Stage Figure 6: Theoretically Figure 6: Mature-Stage Constructed Mature Stage Configuration at 4.5 Years
Conclusions • The qualitative, statistical and visual trends in the data support an evolutionary model for partnership development and maintenance • Six stages in the partnership cycle emerge, each associated with particular activities, issues, and decisions • These findings have important applied implications associated with them • An ideal model can be set up and used to guide new partnerships • Problems in existing partnerships can be diagnosed and addressed, based on structure, change, or lack of change from stage to stage
Brief Examples of Application • Recommendations for changes in the timing and structure of periodic progress reviews • Recommendations for changes in the structure of roles on both sides of the partnership • Recommendations on the types and amount of communication during the transition phase