Download
1 / 20
200 likes | 264 Vues
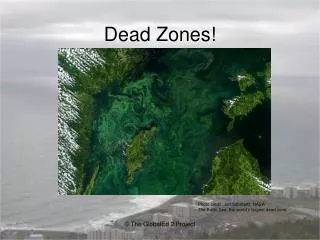
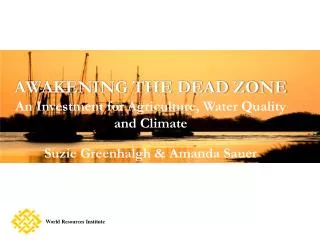
Explore the evolution of the Gulf of Mexico Dead Zone through paleoenvironmental indicators like benthic forams. Analyze data from gravity and box cores to assess hypoxia over the last 1000 years, including potential links to the 1927 Mississippi flood.

E N D
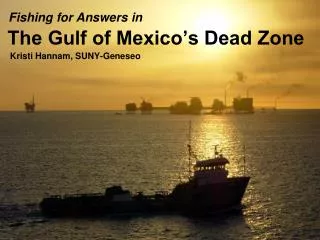
History of the Gulf of Mexico “Dead” Zone Martin B. Farley Dept. of Geology & Geography University of North Carolina at Pembroke
Introduction Audience: Paleontology Undergraduates An Overarching Objective: Historical Perspective (has this been going on all along?)
Major Objectives Applying Deep Time method to “Shallow Time” How Fossils can be Paleoenvironmental Indicators Interpret Change over Time Evaluation of Anthropogenic Cause for Modern Hypoxia
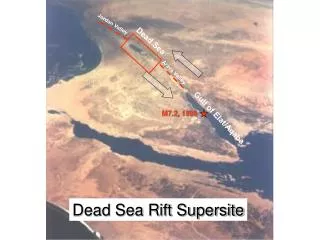
Location and Cores Gravity Core at each location plus Box Core at MRD05-04
Nature of Data Benthic Foram Abundances at 1 cm intervals (gravity cores 1.5-2.4 m; box core 40 cm) Radiocarbon ages at base of two gravity cores (~ 1000 yrs) Lead-210 for box core
Forams for Hypoxia Estimation Degree of anoxia estimated from percentage of low-oxygen tolerant benthics (PEB index) : Protononion atlanticum Epistominella vitrea Buliminella morgani
Initial Student Tasks Calculate PEB index for each core Graph data depth increases down create graphs with similar depth ranges and PEB ranges for ease of comparison
Sample Data File Calculated Fields
Student Questions Interpret PEB index for each cores, relate to location What does the foram record say about the “dead zone” over the last 1000 years? What context does this give for hypoxia over the last few decades? Can you identify a candidate for the anoxia associated with the 1927 Mississippi flood?
PEB Index MRD05-6 Gravity Core Depth (cm)
PEB Index PE0305-1 Gravity Core Depth (cm)
PEB Index MRD05-4 Gravity Core Depth (cm)
PEB Index MRD05-4 Box Core Depth (cm) Plotted at same depth scale as other cores
MRD05-4 Box Core Plot Expanded for detail
Rough Interpretations MRD05-6, outside the modern hypoxia zone, has low PEB PE0305, on edge of modern hypoxia, has spikes in PEB index with increase in shallowest 15 cm The MRD05-04 cores are within the modern hypoxia zone: Longer core--low PEB indexes at bottom, spikes upward; striking increase in shallowest 25 cm Box core -- striking increase in the shallowest 17 cm Data indicate increase in low-oxygen intensity in youngest record.
MRD05-4 Box Core Candidate for 1927 Flood