Download
1 / 45
450 likes | 597 Vues
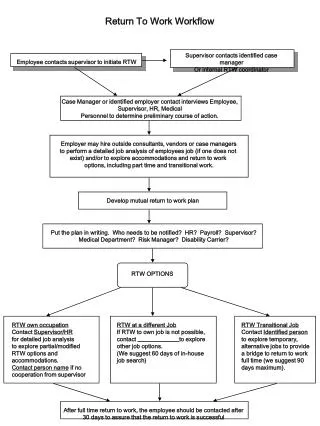
Return-to-Work Outcomes for Texas Injured Workers. Texas Department of Insurance Workers’ Compensation Research and Evaluation Group August 2007. Four Areas of Focus For This Report. Initial return-to-work rate Sustained return-to-work rate Trends in pre- and post- injury wages

E N D
Return-to-Work Outcomes for Texas Injured Workers Texas Department of Insurance Workers’ Compensation Research and Evaluation Group August 2007
Four Areas of Focus For This Report • Initial return-to-work rate • Sustained return-to-work rate • Trends in pre- and post- injury wages • Days off work
Data Sources • Texas Workforce Commission’s wage data for 2001-2006 • Medical billing data for 2001-2005 collected by the Texas Department of Insurance, Division of Workers’ Compensation • Income benefit data and claim data for 2001-2005 collected by the Texas Department of Insurance, Division of Workers’ Compensation
Measures • Initial Return-to-Work (RTW) was computed as the percentage of injured workers back at work for the first time after the injury and this figure was computed at several different points after the injury (six months, one year, one and a half years, two years, and three years). • Sustained RTW was computed as the percentage of injured workers who returned and stayed employed for three or more consecutive quarters after the work-related injury. This number was also computed at incremental points after the injury (six months, one year, one and a half years, two years, and three years). • Median Number of Days Off Work was calculated using the date of injury, the dates when income benefits began and ended, and wage information.
Methods • The focus of this study was on workers injured in 2001-2005 who also received Temporary Income Benefits (TIBs). • If the TIBs received by an injured worker were equal or greater than 70 percent of the injured worker’s average weekly wage, TDI classified the claims as temporary total disability. If TIBs received were less than 70 percent of the worker’s average weekly wage, TDI classified the claims as temporary partial disability. • If a wage was reported in the same quarter as the last total disability income benefit payment, then the last date of total disability benefit payment was considered as the return-to-work date (RTW).
Methods-Continued • For workers without wages in the quarter when total disability benefits ended, the next quarter with wages was identified as the RTW quarter, and the midpoint of that quarter was considered as the RTW date. • If the first quarter with earnings was the quarter following the injury quarter and the worker also earned wages for two or more consecutive quarters, then the first quarter with earnings was considered as RTW quarter. • Days off work = RTW date – (Injury date + 8). • To adjust for the impact of salary continuation on RTW outcomes, if the first quarter with earnings was the quarter following the injury quarter, and the worker did not earn wages for two or more consecutive quarters, then the next quarter with earnings was considered to be the RTW quarter. Note1: The methods described here were based on previous research conducted by the RAND Institute. See: Reville, Robert T., Leslie Boden, Jeff Biddle, Christopher Mardesich. 2001. “An Evaluation of New Mexico Workers’ Compensation Permanent Partial Disability and Return-To-Work.” Santa Monica, CA: RAND. Note2: Injured workers begin to accrue TIBs on the eighth day of disability. See Sections 408.101 - 408.105, Texas Labor Code.
Return-to-Work Ratesfor the Texas Workers’ Compensation System(as of December, 2006)
Initial Return-to-Work Rate Percentage of Injured Workers Back At Work for the First Time 6 Months to 3 Years Post-Injury Source: Texas Department of Insurance, Workers’ Compensation Research and Evaluation Group, 2007. Note 1: The study population includes 329,986 workers injured in 2001-2005 who also received Temporary Income Benefits (TIBs). Note 2: Although the increases of initial RTW rates were small, they were statistically significant at the 0.01 significance level.
Initial Return-to-Work RateOver Time Post Injury Percentage of Injured Workers Back At Work for the First Time 6 Months to 3 Years Post-Injury Source: Texas Department of Insurance, Workers’ Compensation Research and Evaluation Group, 2007. Note 1: The study population includes 329,986 workers injured in 2001-2004 who also received temporary income benefits (TIBs). Note 2: Although the increases of initial RTW rates were small, they were statistically significant at the 0.01 significance level. While this reflects a improvement in the percentage of workers who have initially returned to work, the difference is not big enough to conclude that the WC system improved substantially during this time.
Initial Return-to-Work Rate Percentage of Injured Workers Initially Returned to Their At-Injury Employers 6 Months to 3 Years Post-Injury Source: Texas Department of Insurance, Workers’ Compensation Research and Evaluation Group, 2007. Note 1: The study population includes 329,986 workers injured in 2001-2005 who also received Temporary Income Benefits (TIBs).
Sustained Return-to-Work Rate Percentage of Injured Workers Back At Work and Remained for Three Successive Quarters Beginning With the Initial RTW Quarter 6 Months to 3 Years Post-Injury Source: Texas Department of Insurance, Workers’ Compensation Research and Evaluation Group, 2007. Note 1: The study population includes 329,986 workers injured in 2001-2005who also received temporary income benefits (TIBs).
Sustained Return-to-Work Rate With Equal or More Than Pre-Injury Wages Percentage of Injured Workers Back At Work For Three Successive Quarters and Earned a Wage Equal or More Than Their Pre-injury Wages 6 Months to 3 Years Post-Injury Source: Texas Department of Insurance, Workers’ Compensation Research and Evaluation Group, 2007. Note: 46 percent of workers injured in 2001 and who initially returned for three consecutive quarters in the 6 months following the injury quarter actually returned at their full pre-injury wages.
Sustained Return-to-Work RateWith 70 to 99 Percent of Pre-Injury Wages Percentageof Injured Workers Back At Work For Three Successive Quarters at 70 to 99 Percent of Their Pre-injury Wages 6 Months to 3 Years Post-Injury Source: Texas Department of Insurance, Workers’ Compensation Research and Evaluation Group, 2007. Note: 32 percent of workers injured in 2001 and who initially returned for three consecutive quarters in the 6 months following the injury quarter actually returned at 70 to 99 percent of their pre-injury wages.
Sustained Return-to-Work Rate With Less Than 70 Percent of Pre-Injury Wages Percentage of Injured Workers Back At Work For Three Successive Quarters And Earned a Wage Less Than 70 Percent of Their Pre-injury Wages 6 Months to 3 Years Post-Injury Source: Texas Department of Insurance, Workers’ Compensation Research and Evaluation Group, 2007. Note: 23 percent of workers injured in 2001 and who initially returned for three consecutive quarters in the 6 months following the injury quarter actually returned at less than 70 percent of their pre-injury wages.
Initial Return-to-Work Rateby Injury Typefor the Texas Workers’ Compensation System(as of December, 2006)
Percentage of Injured Workers Initially Back At Work by Injury Type, 1 - 3 Years Post-Injury Source: Texas Department of Insurance, Workers’ Compensation Research and Evaluation Group, 2007.
Percentage of Injured Workers Initially Back At Work by Injury Type, 1 - 3 Years Post-Injury-Continued Source: Texas Department of Insurance, Workers’ Compensation Research and Evaluation Group, 2007.
Initial Return-to-Work Rateby Industryfor the Texas Workers’ Compensation System(as of December, 2006)
Percentage of Injured Workers Initially Back At Work by Industry 1 Year to 3 Years Post-Injury Source: Texas Department of Insurance, Workers’ Compensation Research and Evaluation Group, 2007. Note: “Professional services” include information/finance/insurance, real estate/rental/leasing, professional/scientific/technical services, management of companies and enterprises, administrative/support/waste management/remediation services. “Other services” include repair and maintenance, personal and laundry services, religious, grant making, civic, professional and similar organizations, and private households.
Percentage of Injured Workers Initially Back At Work by Industry 1 Year to 3 Years Post-Injury Continued Source: Texas Department of Insurance, Workers’ Compensation Research and Evaluation Group, 2007. Note: “Professional services” include information/finance/insurance, real estate/rental/leasing, professional/scientific/technical services, management of companies and enterprises, administrative/support/waste management/remediation services. “Other services” include repair and maintenance, personal and laundry services, religious, grant making, civic, professional and similar organizations, and private households.
Initial Return-to-Work Rateby Geographic Regionfor the Texas Workers’ Compensation System(as of December, 2006)
Percentage of Injured Workers Initially Back At Work by Geographic Region 1 Year to 3 Years Post-Injury Source: Texas Department of Insurance, Workers’ Compensation Research and Evaluation Group, 2007. Note: “West” Texas includes E1 Paso, Midland Odessa, and San Angelo. “South” Texas includes Corpus Christi, Galveston, Houston, Harlingen, Laredo, San Antonio, Victoria, Missouri City, and Weslaco. “Central” Texas includes Austin, Bryan/College Station, and Waco. “East” Texas includes Beaumont, Lufkin, and Tyler. North includes Abilene, Amarillo, Dallas, Denton, Fort Worth, Lubbock, and Wichita Falls. 437 claims without field office information were excluded for analysis.
Percentage of Injured Workers Initially Back At Work by Geographic Region 1 Year to 3 Years Post-Injury Continued Source: Texas Department of Insurance, Workers’ Compensation Research and Evaluation Group, 2007. Note: “West” Texas includes E1 Paso, Midland Odessa, and San Angelo. “South” Texas includes Corpus Christi, Galveston, Houston, Harlingen, Laredo, San Antonio, Victoria, Missouri City, and Weslaco. “Central” Texas includes Austin, Bryan/College Station, and Waco. “East” Texas includes Beaumont, Lufkin, and Tyler. North includes Abilene, Amarillo, Dallas, Denton, Fort Worth, Lubbock, and Wichita Falls. 437 claims without field office information were excluded for analysis.
Sustained Return-to-Work Rateby Injury Typefor the Texas Workers’ Compensation System(as of December, 2006)
Sustained Return-to-Work Rate by Injury Type Percentage of Injured Workers Back At Work for Three Successive Quarters, 6 Months to 3 Years Post-Injury Source: Texas Department of Insurance, Workers’ Compensation Research and Evaluation Group, 2007. Note: 32,504 claims with missing injury types were classified as “unknown.”
Sustained Return-to-Work Rate by Injury Type Percentage of Injured Workers Back At Work for Three Successive Quarters, 6 Months to 3 Years Post-Injury Continued Source: Texas Department of Insurance, Workers’ Compensation Research and Evaluation Group, 2007. Note: 32,504 claims with missing injury types were classified as “unknown.”
Sustained Return-to-Work Rateby Industryfor the Texas Workers’ Compensation System(as of December, 2006)
Sustained Return-to-Work Rate by Industry Percentage of Injured Workers Back At Work for Three Successive Quarters, 6 Months to 3 Years Post-Injury Source: Texas Department of Insurance, Workers’ Compensation Research and Evaluation Group, 2007. Note: “Professional services” include information/finance/insurance, real estate/rental/leasing, professional/scientific/technical services, management of companies and enterprises, administrative/support/waste management/remediation services. “Other services” include repair and maintenance, personal and laundry services, religious, grant making, civic, professional and similar organizations, and private households.
Sustained Return-to-Work Rate by Industry Percentage of Injured Workers Back At Work for Three Successive Quarters, 6 Months to 3 Years Post-Injury Continued Source: Texas Department of Insurance, Workers’ Compensation Research and Evaluation Group, 2007. Note: “Professional services” include information/finance/insurance, real estate/rental/leasing, professional/scientific/technical services, management of companies and enterprises, administrative/support/waste management/remediation services. “Other services” include repair and maintenance, personal and laundry services, religious, grant making, civic, professional and similar organizations, and private households.
Sustained Return-to-Work Rate by Geographic Regionfor the Texas Workers’ Compensation System(as of December, 2006)
Sustained Return-to-Work Rate by Geographic Region Percentage of Injured Workers Back At Work for Three Successive Quarters, 6 Months to 3 Years Post-Injury Source: Texas Department of Insurance, Workers’ Compensation Research and Evaluation Group, 2007. Note: “West” Texas includes E1 Paso, Midland Odessa, and San Angelo. “South” Texas includes Corpus Christi, Galveston, Houston, Harlingen, Laredo, San Antonio, Victoria, Missouri City, and Weslaco. “Central” Texas includes Austin, Bryan/College Station, and Waco. “East” Texas includes Beaumont, Lufkin, and Tyler. “North” Texas includes Abilene, Amarillo, Dallas, Denton, Fort Worth, Lubbock, and Wichita Falls. 437 claims without field office information were excluded for analysis.
Sustained Return-to-Work Rate by Geographic Region Percentage of Injured Workers Back At Work for Three Successive Quarters, 6 Months to 3 Years Post-Injury Continued Source: Texas Department of Insurance, Workers’ Compensation Research and Evaluation Group, 2007. Note: “West” Texas includes E1 Paso, Midland Odessa, and San Angelo. “South” Texas includes Corpus Christi, Galveston, Houston, Harlingen, Laredo, San Antonio, Victoria, Missouri City, and Weslaco. “Central” Texas includes Austin, Bryan/College Station, and Waco. “East” Texas includes Beaumont, Lufkin, and Tyler. “North” Texas includes Abilene, Amarillo, Dallas, Denton, Fort Worth, Lubbock, and Wichita Falls. 437 claims without field office information were excluded for analysis.
Wage Trendsfor the Texas Workers’ Compensation System(as of December, 2006)
Wage Comparison Results Overall –In general, from injury years 2001-2005, there were slight improvements in the amount of time it took for injured workers to return to wage levels comparable to their pre-injury wages. For injury years 2001 and 2002, injured workers generally did not return to pre-injury wage levels until more than one year after their injury quarter; however, workers injured in 2003, 2004, 2005 were generally able to return to pre-injury wage levels between 9 and 12 months after their injury quarter.By Injury Type – There were significant differences in pre-injury wages across the injury types. In general, workers with knee internal derangement injuries had the highest median quarterly wages, while workers with hand/wrist superficial trauma injuries had the lowest median quarterly wages. Additionally, there were significant differences across injury types in the time it took injured workers to return to their pre-injury wages. Generally, workers with hand/wrist superficial trauma returned to their pre-injury wages the fastest (1 quarter), while workers with low back, neck and hand/wrist nerve compression injuries returned to their pre-injury wages the slowest .
Wage Comparison Results, continued By Industry – There were also significant differences in pre-injury wages across industry sectors. In general workers in public administration had the highest median quarterly wages while workers in arts/accommodation had the lowest median quarterly wages. There were slight differences across industry sectors for the time it took injured workers to return to their pre-injury wages. Generally, workers in agriculture and public administration returned to pre-injury wages the fastest (2-3 quarters), while workers in manufacturing returned to pre-injury wages the slowest (4 to 5 quarters). By Geographic Region – There were significant differences in pre-injury wages across geographic regions. Ranked from the highest median quarterly wage ($7,344) to the lowest median quarterly wage ($5,983), they are north, east, south, central, and west. There were no significant differences across geographic region for the time it took injured workers to return to their pre-injury wages.
Median Quarterly Wages (Pre-/Post- Injury) for Injured Workers Receiving Temporary Income Benefits Injury years 2001 - 2005 Source: Texas Department of Insurance, Workers’ Compensation Research and Evaluation Group, 2007. Note: For the marks on the X-axis, Pre injury quarter means the quarter before the injury quarter, Post1 means the first quarter after injury, and Post2 means the second quarter after the injury quarter.
Median Quarterly Wages (Pre-/Post- Injury) For Injured Workers Receiving Temporary Income Benefits Injury Years 2001 - 2005 Source: Texas Department of Insurance, Workers’ Compensation Research and Evaluation Group, 2007. Note: Pre means the quarter before the injury quarter, Injury means the injury quarter, Post1 means the first quarter after injury, and Post2 means the second quarter after the injury quarter.
Mean and Median Days Off Workfor Injured Workers Who RTW At Some Point Post Injury Injury Years 2001-2004 Source: Texas Department of Insurance, Workers’ Compensation Research and Evaluation Group, 2007. Note1: The mean and median days off work in 2004 may be under-estimated due to data maturity and should be viewed with caution. Note2: “Days Off Work” was defined as days from the injury date to the initial RTW date. Please note that these numbers do not take into account any additional time off work that may have occurred after the initial RTW date. Note3: The analysis was based on the claimants who returned to work, and did not include those who did not return by the end of 2006. Injury year 2005 was excluded because of insufficient data.
Mean and Median Days Off Work for Injured Workers Who RTW at Some Point Post Injury by Injury Type, Injury Years 2001-2004 Source: Texas Department of Insurance, Workers’ Compensation Research and Evaluation Group, 2007.
Mean and Median Days Off Work for Injured Workers Who RTW at Some Point Post-Injury by Industry, Injury Years 2001-2004 Source: Texas Department of Insurance, Workers’ Compensation Research and Evaluation Group, 2007. Note: “Professional services” include information/finance/insurance, real estate/rental/leasing, professional/scientific/technical services, management of companies and enterprises, administrative/support/waste management/remediation services. “Other services” include repair and maintenance, personal and laundry services, religious, grant making, civic, professional and similar organizations, and private households.
Mean and Median Days Off Work for Injured Workers Who RTW at Some Point Post-Injury by Geographic Region, Injury Years 2001-2004 Source: Texas Department of Insurance, Workers’ Compensation Research and Evaluation Group, 2007. Note: “West” Texas includes E1 Paso, Midland Odessa, and San Angelo. “South” Texas includes Corpus Christi, Galveston, Houston, Harlingen, Laredo, San Antonio, Victoria, Missouri City, and Weslaco. “Central” Texas includes Austin, Bryan/College Station, and Waco. “East” Texas includes Beaumont, Lufkin, and Tyler. “North” Texas includes Abilene, Amarillo, Dallas, Denton, Fort Worth, Lubbock, and Wichita Falls. 437 claims without field office information were excluded for analysis.
Summary • About 70 to 75 percent of workers returned to work at some point within two quarters (approximate 6 months) after the injury quarter. About 61 to 68 percent of workers returned and retained employment for three or more successive quarters. For those who returned for three or more successive quarters, only about 45 percent of them returned to their pre-injury wage. About 64 to 69 percent of workers returned initially to their employers for whom they worked at the time of the injury. • About 12 to 15 percent of injured workers had not returned to work two years after the injury quarter. For the workers who returned and retained employment for three or more successive quarters, about 25 percent of them returned with wages less than 70 percent of their pre-injury wages. • Workers with hand-wrist superficial trauma and ankle-foot soft tissue injuries generally returned to work faster than workers with other injuries. About 87 percent of those workers returned to work at some point within one year after the injury quarter and 91 percent returned within two years after the injury quarter.
Summary-Continued • Workers with low-back nerve compression injuries returned to work much slower than workers with other injuries. Only about 66 percent of them returned to work at some point within one year after the injury quarter. About 76 percent of them returned within two years after the injury quarter. • Workers in public administration returned to work fastest. Workers in mining/utilities/construction returned much slower than workers in other industries. • There were significant differences across regions in terms of initial bi-quarter RTW rates. Ranked from the highest to the lowest, they are central, north, west, south, east. • From 2001 to 2005, the initial RTW rate and sustained RTW rate have been on an increasing trend. • It took about one year for the median of quarterly wages to return to the pre-injury level. There were significant differences across injury types for the time it took the injured workers to return to their pre-injury wages.
Summary-Continued • Although the differences in quarterly median wages across industries and across geographic regions were significant, the patterns at which wages returned to their pre-injury levels were quite similar. • The median days off work have decreased slightly from 32 days for workers injured in 2001 to approximate 31 days for workers injured in 2003. • Significant differences exist in median days off work across injury types: from 20 days for hand-wrist superficial injuries to 74 days for low-back nerve compression. • Moderate differences in median days off work across industries ranged from 21 days in public administration to 35 days in mining/utilities/construction. • Small differences in median days off work across regions: from 25 days in central to 31 days in west.