Download
1 / 36
360 likes | 525 Vues
Alabama’s Water Quality Assessment and Listing Methodology. ADEM QA Workshop February 13, 2006. Background…. Section 305(b) of the Clean Water Act requires that states report on the condition of their waters every two years The report is due to EPA on April 1 of each even numbered year

E N D
Alabama’s Water Quality Assessment and Listing Methodology ADEM QA Workshop February 13, 2006
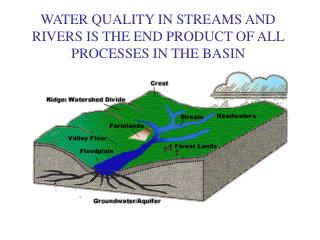
Background…. • Section 305(b) of the Clean Water Act requires that states report on the condition of their waters every two years • The report is due to EPA on April 1 of each even numbered year • The report describes the quality the state’s waters relative to the state’s water quality standards • The report is intended to inform Congress on the progress being made to fulfill the mandate of the Clean Water Act – “restore and maintain the chemical, physical, and biological integrity of the Nation’s waters.”
How? It Starts with Monitoring • Monitoring data, primarily water quality data from surface waters, provides the basis for determining the status of water quality • How clean is clean enough? Alabama’s water quality standards (335-6-10 and 335-6-11) are the yardstick we use to measure the degree to which waters are clean enough to support their designated uses
Water Quality Assessment…. • We need some instructions on how to use the yardstick • The assessment and listing methodology describes the process of using measured water quality data and biological assessment information to determine when waters are supporting their designated uses
Listing Methodology???? • Prior to the 1998 303(d) list Alabama had no formal assessment and listing methodology • Impaired waters were defined based on information contained in the State’s 305(b) Report – Appendix E • The use support status was assigned based on an unspecified and mysterious process know as the “Mike Rief” formula (later know as the “Lynn Said” method) • In 1999 EPA added waters to Alabama’s 303(d) list using the “EPA Said” method
The Early Assessment Model(Model A) • For the 1998 303(d) list ADEM developed an assessment and listing methodology based loosely on EPA’s 1997 Supplemental 305(b) guidance • It included minimum data requirements, threshold for number of exceedances of criterion, consideration of biological data, and consideration of fish and shellfish consumption advisories • However, the “Lynn Said” method still played a major role in the development of the list
For the 2002 List Cycle… • EPA’s 305(b) / 303(d) guidance changed and gave states the option to use an Integrated Report (5-part list) to satisfy reporting requirements of 305(b) and 303(d) • Alabama did not select this option but chose to submit both reports (305(b) and 303(d)) using the previous guidance and listing methodology
For the 2004 List Cycle… • EPA issued additional clarifying guidance about the 5-part list and asked that states use the new format, if possible • Alabama adopted the new Integrated Report format but continued to use the previous listing methodology (303(d)) • By this point, something new was on the horizon…..
In 2005…. • EPA issued additional guidance concerning the content of the Integrated Report and the listing methodology for the 2006 Cycle • Alabama drafted a new assessment and listing methodology to be used in preparation of the 2006 Integrated Report
New and Improved…. • Alabama’s New Assessment and Listing Methodology was written to: • Provide EPA and the Public with a clear understanding of how the state assesses designated use support for its surface waters • Ensure consistency in assessing waters • Aid the state in planning future work and resource needs
The 2010 Assessment and Listing Methodology…. • Assesses a waterbody’s designated use support status by considering: • Chemical data • Conventional pollutants - BOD, nutrients, solids • Toxic pollutants – metals, pesticides, ammonia • Physical data • In situ parameters – pH, temperature, DO, turbidity • Habitat characteristics for wadeable streams • Biological data • Aquatic communities – macros, fish, bacteria, algae, periphyton
Alabama’s Categories…. • Category 1 – All uses fully supported • Requires a rigorous data analysis of a dataset that satisfies the minimum data requirement • Category 2 – Insufficient data to determine if all uses are fully supported • Prioritizes future sampling (2a, 2b) • Category 3 – We know nothing about this water (other than some generalizations about its watershed) • Some of these waters may be included in basin rotation monitoring plan during each cycle
Alabama’s Categories…. • Category 4 – Impaired waters that do not need a TMDL • Track TMDL development (4a) • Track Implementation of “other control measures” (4b, 4c) • Category 5 – Impaired waters that do need a TMDL • Basis for TMDL development program • Priority for future monitoring (if needed)
Methodology Design – What Must it Do? • The assessment and listing methodology must do the following: • Populate the 5 categories of waters described in Alabama’s 5-part list and outlined in the EPA guidance • Provide a scientifically defensible process for determining use impairment (303(d) listing/delisting) • Recognize the different levels of aquatic life use established in Alabama’s water quality standards • OAW ------------------------------------------------------ A&I • Provide the public with a clear understanding of what is required to determine designated use support or non-support
How Does it Work? • Data and information are put through a series of filters that are specific to the water’s designated use • The first filter is the minimum data filter • Waters not passing the minimum data filter go to Category 2 or Category 3 (if no data) • Waters passing the minimum data filter go to the second filter
How Does it Work? • The second filter compares the available data to the water quality criteria for the designated use • If the data indicate “compliance” with the criteria, the water is placed in Category 1 • If the data indicate “noncompliance” with the criteria, the water is placed in Category 5
How Does it Work? • The threshold for “noncompliance” is specific to the particular use and/or waterbody type • Sensitive waters (OAW) have a lower threshold than Fish and Wildlife waters • Wadeable streams can have a different threshold than nonwadeable streams
What Does It Mean to the Monitoring Program? • The methodology establishes new minimum data requirements for each of Alabama’s seven designated uses • The goal of the assessment process is to place each waterbody in Alabama into one of the five categories mentioned earlier • The assessment period is 6 years long and minimum data requirements can be met using data from several years and from several sources if the data are “comparable”
Minimum Data Requirements • Minimum data requirements are dictated by use classification and waterbody type • OAW: • Wadeable stream • Non-wadeable stream / river • Reservoir • Estuary or coastal water • A waterbody must satisfy the minimum data requirements to be placed in Category 1 or 5 with only a few exceptions
Minimum Data Requirements… • In general, wadeable streams will require: • 1 or more biological assessments including habitat + 3 conventional parameter measurements + 5 bacteriological measurements • Biological assessment could include: • 1 Level IV Intensive Wadeable Multi-habitat Bioassessment (WMB-I) • 2 Level III Wadeable Multi-habitat Bioassessments (WMB-EPT) • 1 WMB-EPT + 1 Fish IBI (Cahaba / Warrior Basins) • Or 8 or more conventional parameter measurements + 10 bacteriological + 5 pesticide/herbicide + 5 inorganic (metals)
Minimum Data Requirements… • In general, non-wadeable streams will require: • 8 or more conventional parameter measurements + 10 bacteriological + 5 pesticide/herbicide + 5 inorganic (metals)
Minimum Data Requirements… • In general, reservoirs will require: • 8 conventional parameter measurements + 3 bacteriological samples + 1 fish tissue analysis + 7 chlorophyll a samples (where a criterion is in place)
Minimum Data Requirements… • In general, coastal waters will require: • 8 or more conventional parameter measurements + 10 bacteriological + 1 fish tissue analysis • OR 8 or more conventional parameter measurements + 10 bacteriological + 5 pesticide / herbicide + 5 inorganic (metals)
Data Quality… • Data collected by third parties and submitted to the Department must be collected and analyzed consistent with the procedures specified in the Department’s SOP manuals. • In most cases, this means that a study plan with specific methods and procedures should accompany data submitted to the Department for consideration.
So, once we have the data… • A review of available data will result in the placement of a waterbody in either • Category 1 – met minimum data requirement and fully supports uses • Category 2A – did not meet minimum data requirement but available data indicates possible impairment – collect more data. • Category 2B – did not meet minimum data requirement but available data does not indicate impairment – collect more data later • Category 5 – met minimum data requirement and an impairment is indicated – 303(d) List
So, what goes in Category 5? • Each designated use has a slightly different impairment threshold • In general, wadeable streams will be placed in Category 5 when: • WMB-I is poor or both WMB-EPT are poor due to anthropogenic causes • More than two exceedances of a toxic pollutant criterion • An conventional parameter exceeds its criterion in more than 10% of the samples based on the binomial distribution • A Fish Consumption Advisory is issued by the ADPH
Here’s an Example: • A water quality study is conducted on a wadeable stream in the Choctawhatchee River Basin • A WMB-I biological assessment is conducted along with several habitat assessments. The habitat assessment rates the site as “Poor” and the biological assessment indicates a “Poor” macro community. Water quality data looked normal. • So what’s the problem? Why the “Poor” biology?
Example…. • Specific comments recorded by the field biologist describe the site as “Channelized heavily. Soft sand bottom heavily covered in silt. No Root Bank. Sand, CPOM, Log Wash samples consist of all Chironomidae. No EPT taxa found. This stream is in pathetic shape!” • Result – Category 5 for siltation
Determining Use Support: the “10% Rule” • Probably the most misunderstood part of the methodology • The methodology uses a binomial distribution to estimate the number of exceedances of a criterion in a given number of samples needed to say with a known confidence that the exceedance rate is greater than 10% • Used for conventional parameters
Using the “10% Rule” for Delisting • Not the same thing as listing • Uses a binomial distribution to estimate the number of exceedances of a criterion in a given number of samples needed to say with a known confidence that the exceedance rate is less than 10%