Download
1 / 42
420 likes | 566 Vues
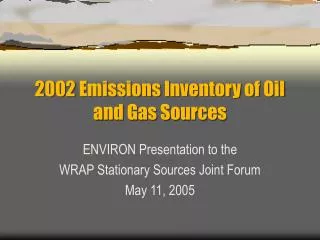
2002 Emissions Inventory of Oil and Gas Sources. ENVIRON Presentation to the WRAP Stationary Sources Joint Forum May 11, 2005. Outline for Today’s Presentation. Draft emission inventory of oil and gas sources Methodology used to estimate area source emissions

E N D
2002 Emissions Inventory of Oil and Gas Sources ENVIRON Presentation to the WRAP Stationary Sources Joint Forum May 11, 2005
Outline for Today’s Presentation • Draft emission inventory of oil and gas sources • Methodology used to estimate area source emissions • Inclusion of controls and reconciliation with point source inventories • Status of the inventory of oil and gas sources on tribal lands • Projections
2002 Oil & Gas Emission Inventory • Area Sources covered • Oil/Gas well drilling (NOx) – drill rig prime movers • Natural gas compressor engines (NOx) • Wellhead activities – (NOx, VOC) dehydration, heaters, tanks, etc… • Coal bed methane generators • Point Sources • Compressor stations • Gas plants • Other smaller sources depending upon states’ inventory thresholds
Map of Wells and Point Sources Well locations were not obtained for California as CARB provided county-level emissions estimates
2002 Draft NOx Emissions 1The point source inventory obtained for Arizona from EDMS does not contain NOx emissions. We will attempt to obtain that data from the State. 2Area source emissions for California were calculated by State agencies.
2002 Draft Area Source NOx Emissions 1State agencies indicate compressors and wellhead equipment are found in point source inventory. Only drill rig and completion emissions are reported here as area sources. 2Compressors are included in point source inventory, i.e. there are no area source emissions.
Drilling • Contacted drilling companies to request additional data (6 total) • Obtained drill permit data from Oil and Gas Commissions • Obtained emissions data for drill rigs from WYDEQ survey
Summary of Data Collected • Contacted drilling companies chose not to contribute data at this time • Pertinent oil and gas commissions’ permit data • Well depth • Spud date – date drilling begins • Completion date – date well preparation is finalized; occurring with some delay after drilling ceases • WYDEQ survey of drilling emissions in Jonah-Pinedale
Revised Drilling Methodology • Have base activity data from permits • Lack a more sophisticated level of activity data • Equipment types • Load factor • Operational schedule • WYDEQ survey has this additional data
Jonah-Pinedale survey emission factors 13.5 tons NOx / well 3.3 tons SO2 / well Well drilling emissions dependent upon Depth of well Composition of substrate Drilling equipment Need to scale emission factor to other areas using available data Well depth Approximation of drilling duration Utilizing Jonah-Pinedale Survey Data
Procedure Used to Scale J-P EFs • Assumptions • Though the completion date does not equal the date drilling ceases, the difference between the two is on average constant relative to total duration of preparation activities • The capacity of the equipment used to drill a well is dependent upon the depth of the well • Interpretation: Scaling the emission factor based on well depth and “duration” corrects for variations due to well depth, composition of substrate and engine capacity
Calculation for Scaling J-P EFs • Data shows that drilling activities within a single formation vary within a small range • A formation specific emission factor permits use of local data without suggesting accuracy for an individual well
Calculation of Drilling Emissions • Emissions calculated by formation as the product of the number of wells spudded in the formation in 2002 and the formation-specific emission factor • Formation emissions then allocated to counties
2002 Draft Drilling Emissions Estimates 1SO2 emissions will be adjusted for varying fuel sulfur levels
Natural Gas Compressor Engines • Contacted compressor operators to request activity data • Obtained production data from oil and gas commissions • Reviewed existing inventories of compressor engines
Initial Data Gathering • Contacted compressor renters/owners but none was willing to provide data at this point • Reviewed other sources of data • Colorado’s 2002 point source emission inventory (2004) • New Mexico Oil and Gas Association’s (NMOGA) 2002 Inventory of Unpermitted Sources in the San Juan Basin (2003) • BLM Environmental Impact Statements • 2002 Inventory of East Texas Emissions (2005)
Analyze existing inventory data to develop production based emission factor Use 2002 gas production reported by oil and gas conservation commissions as activity Revised Compressor Engine Methodology
Colorado 2002 Emissions Inventory • Coverage: Inventoried sources down to 2 tpy of emissions. • Analysis: Extract small compressor engines from inventory and compare to county level gas production • Results inconclusive • Insufficient information to extract only compressor engines • Difficult to determine the fraction of emissions that would represent area source emissions in other states • Limited results suggest good correlation between engine emissions and gas production
NMOGA 2002 Emissions Inventory • Coverage: Obtained data representing activity at 10,582 of 17,108 wells in the San Juan Basin – New Mexico • Analysis: Extract emissions from compressors and compare to gas production for the same region • Total emissions for compressor engines = 23,934 tons • Total 2002 gas production for San Juan, Rio Arriba and Sandoval Counties = 1,030,453 MMCF • Obtained emission factor of 2.3x10⁻⁵ tons NOx / MCF
BLM Environmental Impact Statements • Coverage: Powder River Basin EIS (2002) includes most detailed air quality impact analysis • Estimated production • Estimated equipment requirements as quantity of 380 hp compressors to be installed and assumption of their activity • Analysis: Combine equipment activity estimates with EPA emission factor to estimate emissions and relate projected emissions to projected production • Obtained emission factor of 4.4x10⁻⁴ tons NOx/MCF • Difficulty: Projected equipment and production, not actual
East Texas 2002 Emission Inventory • Coverage: The Tyler/Longview/Marshall Flexible Attainment Region • Method of East Texas EI: Used survey of operators to develop production based emission factor • Emission factor: 5.6x10⁻⁵ tons NOx / MCF • Survey data have been requested for verification and possible additional analysis
Method for Estimating Compressor Engine Emissions • Emission factor: 2.3x10⁻⁵ tons NOx / MCF, derived from NMOGA inventory • Activity data: Gas production obtained from oil and gas commissions
Exceptions to the Compressor Engine Methodology • Colorado – compressor engines are included in the State’s point source emission inventory • Alaska – discussion with personnel of the Alaska OGCC and DEC determined that compressors of this kind would fall within permitted facilities
2002 Draft Compressor Engine Emissions Estimates 1State agencies indicate compressors will be found in point source inventory, i.e. there are no area source emissions 2Compressors are included in point source inventory, i.e. there are no area source emissions 3,4Emissions shown here are adjusted for controls reported by the State DEQ
CBM Generators • Contacted State DEQs to request permitted generator databases • Obtained information on CBM field electrical supply from OGCs • Obtained water production data for CBM wells from OGCs Progressing cavity pump with generator (behind) used for dewatering a CBM well
Summary of Data Collected • Generator databases • Wyoming database of diesel generators • Generator make, model, emission factor • Generator activity (hours per year) • Wyoming list of permitted natural gas generators • Field power supply • Fields electrified: Montana and Utah • Generators used: Wyoming, Colorado and New Mexico • Pertinent OGC data • Well depth • Water produced
CBM Generator Methodology • Wyoming, Colorado and New Mexico wells use generators to power pumps • Only Wyoming DEQ was able to provide database of CBM generators • Derive relationship between water production and generator activity from WY data and apply to water production at CBM wells in CO and NM
Wyoming CBM Generators • Activity of diesels used to estimate activity of natural gas generators (ratio of “operated capacity”, see formula below) • State total diesel generator activity = 26.4 M hp-hrs • Estimated state total natural gas generator activity = 42.4 M hp-hrs
CBM Generator Activity • Work performed by generators is related to: • mass of water moved • depth of well • efficiency of pump • Assumption: Reservoir pressure effect negligible
Wellhead Activities • Used emission factors developed by WYDEQ • Adjusted controls assumed in WYDEQ tanks emission factor for local conditions • Replaced WYDEQ factors when local factors provided • Obtained oil and gas production data from oil and gas commissions
Exceptions for Wellhead Emissions Calculations • Colorado Department of Health and Environment provided an emission factor for completion emissions, 16.664 ton VOC per completion • From discussion with the Alaska OGCC and DEC we determined that wellhead equipment of these types would not exist outside permitted facilities
Calculation of Wellhead Emissions • Divided production into that occurring at oil wells and that occurring at gas wells based on OGC data • Estimated emissions for oil wells based on production at oil wells and emissions at gas wells based on production at gas wells and WYDEQ emission factors for each well type
2002 Draft Wellhead Emissions Estimates 1State agencies indicate wellhead equipment will be found in point source inventory, thus only emissions from completion activities have been included.
Point vs. Area Reconciliation 1Smaller equipment is reportedly grouped in large facilities. This will be verified by determining if a reasonable equipment count is found within the inventory of these large facilities.
Steps to Complete the 2002 Inventories • Revise draft emissions estimates if any new factors and/or activity data are provided • Incorporate additional data from stakeholders, if provided • Eliminate sources on tribal lands from States’ inventories and provide separate tribal inventories
Tribal Emission Inventories • Reviewed existing inventories • Mapped state and tribal sources to facilitate elimination of overlap • Collected production data • Collecting additional data on medium sources (25 < PTE < 100 tpy) from tribal agencies and producers
Projections • Data available from State agencies limited • BLM Resource Management Plans seem to be the best source of data • Backup will be to use EIA forecasts • Incorporate information on upcoming controls gathered from State agencies