Download
1 / 6
60 likes | 254 Vues
1. Independence of error assumption. In many business applications using regression, the independent variable is TIME. When the data (Y i ) is collected at regular intervals of time you have a time series. In such cases the errors are likely

E N D
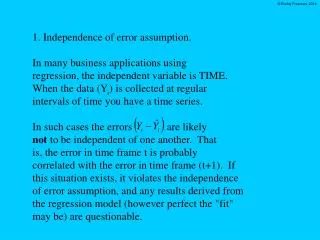
1. Independence of error assumption. In many business applications using regression, the independent variable is TIME. When the data (Yi) is collected at regular intervals of time you have a time series. In such cases the errors are likely not to be independent of one another. That is, the error in time frame t is probably correlated with the error in time frame (t+1). If this situation exists, it violates the independence of error assumption, and any results derived from the regression model (however perfect the "fit" may be) are questionable.
Each Excel workbook in S:\BFREEMAN\QM3620\Course Files\Segment3\ExcelFiles\Simple Linear Regression and Correlation contains a worksheet labeled “Independence of Error” that provides the calculation of the Durbin-Watson statistic to test for such violations. However, the test is not always yes or no. It has a “we are not sure” portion. You need a table of "ranges" to determine if: (a) The assumption is valid for our model and . (b) The assumption is not valid for our model and . (c) We are not sure if the assumption is valid or not for our model and .
2. Equality of Variances assumption. This assumption can be tested by examining a plot with the predicted values on the horizontal (X axis) and the “standardized errors” (Studentized residuals) on the vertical (Y axis). Each Excel workbook in S:\BFREEMAN\QM3620\Course Files\Segment3\ExcelFiles\Simple Linear Regression and Correlation contains a worksheet labeled “Equal Variances” that provides the values of the Studentized residuals and the predicted values used to generate a graph to test for such violations. To make the graph display the data properly, one has to set the X Values to the range of Predicted Y values in column B.
If this assumption is violated you will probably see "triangular" patterns. If the pattern has a fairly constant "height" across the range of the predicted values, the assumption is probably valid. Even if it is violated, sometimes you can still come up with a valid model by applying a "correcting" transformation.
3. Normality assumption. You can use the Histogram tool in Excel’s Data Analysis Tools to build a histogram of the errors and see if they appear to be normally distributed. As long as it is not "too" nonnormal, you will have a valid model. Regression is "robust" with respect to the normality assumption. For a more rigorous normality test, you may use the use the Anderson-Darling goodness-of-fit test for normality.
A Z Each Excel workbook in S:\BFREEMAN\QM3620\Course Files\Segment3\ExcelFiles\Simple Linear Regression and Correlation contains a worksheet labeled “Normality” that provides the values of the errors (Residuals). Use the cursor to select all the Residuals. Copy them and perform a paste special (Values) under the heading “Sorted Residuals.” Click on the symbol at the top to sort these values into ascending order. The approximate P-Value may then be used to assess the assumption of normality.