Download
1 / 22
220 likes | 384 Vues
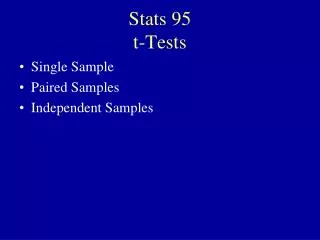
Some Details about Our Bivariate Stats Tests. Conceptualizing the four stats tests Conceptualizing NHST, critical values and p-values NHST and Testing RH: Distinguishing Type III error from “results contrary to our RH”. Let’s work with this “arrangement” of the 4 tests …

E N D
Some Details about Our Bivariate Stats Tests • Conceptualizing the four stats tests • Conceptualizing NHST, critical values and p-values • NHST and Testing RH: • Distinguishing Type III error from “results contrary to our RH”
Let’s work with this “arrangement” of the 4 tests … we’ll examine these by contrasting each of the following pairs… • tests of bivariate association (2 quant vs. 2 qual variables) • tests of mean differences (between groups vs. within groups) • analysis of repeated measures data (assoc vs. mean dif.) • between groups comparisons (quant mean vs. qual pattern dif.) r X2 FWG FBG
tests of bivariate association (quant vs. qual variables) • Both of these ask “whether there is a relationship between the variables in the population represented by the sample" rX2 FWG FBG • The difference is whether the two variables are • quantitative -- use Pearson’s correlation • qualitative/categorical -- use Pearson’s X2 • H0:s are similar, but have different “key words” • r -- There is no linear relationship between the quantitative variables, in the population represented by the sample • X2-- There is no pattern of relationship between the qualitative variables, in the pop represented by the sample • Example…(which stat for which?) … • Is whether or not patients receive therapy related to whether or not they improve ? • Is #therapy sessions related to decrease in #symptoms ? X2 r
tests of mean differences (between groups vs. within groups) r X2 FWGFBG • Both of these ask “whether there is a mean difference on the quantitative variable between the populations represented by the two conditions" • The difference is whether the two populations are: • represented by different sets of parts in each condition -- BG • represented by the same set of parts in both conditions - WG • H0:s are exactly the same, because H0:s are about populations • FBG&FWG- the populations represented by the conditions have the same mean on the quantitative variable • Example…(which stat for which?) … • Does the mean anxiety change from before to after therapy ? • Is the mean anxiety different whether or not patients receive therapy? FWG FBG
analysis of repeated measures data (assoc vs. mean dif.) • Both of these stats can be applied to the data from a repeated measures design -- but they are used to ask different questions rX2 FWG FBG • FWG-- is used to ask if there is a mean difference between the measure taken during the two different times/treatments • r -- is used to ask if we can use a participant’s score during one time/treatment to predict their score during the other (prediction based upon the variables being linearly related) • Example… Patients entering therapy for depression were asked to complete the “Beck Depression Inventory” during the first therapy session (pretest) and again during their last session (posttest). The therapist had two questions (which stat for which?) … • Is the mean posttest score lower than the mean pretest score? • Does a person’s pretest score predict their posttest score ? FWG r
Let’s take another look at this distinction... In a study of recall memory in young adults, participants were given a list of 40 common words to study for 5 minutes. Then they were given a blank piece of paper and instructed to write down all the words they could recall from the list. Data were collected for the two kinds of recall errors -- “exclusions” (words on the list that weren’t written down) and “intrusions” (words that weren’t on the list that were written down). The researcher has 2 RH: about how the variables are related. RH #2 Those participants who have more intrusions will also be those that have more exclusions. RH #1There will be more exclusions than intrusions. • Type of research question: • mean difference? • linear relationship ? • Type of research question: • mean difference? • linear relationship ? Proper Statistic? correlation Proper Statistic? WG ANOVA H0: Mean number of exclusions and intrusions are the same in young adults RH: Larger mean exclusions than mean intrusions in young adults H0: No linear relationship between the number of intrusions and exclusions in young adults RH: Positive linear relationship between the number of intrusions and exclusions in young adults FBG X2 Stat? Stat?
Your turn… I have two questions about the relationship between Exam #1 and Exam #2 scores in this class. Question #1: Those Psyc 350 students who do poorly on Exam #1 will also do poorly on Exam #2 Stat: H0:` RH: r There is no linear relationship between Exam #1 and Exam #2 scores among Psyc 350 students There is a positive linear relationship between Exam #1 and Exam #2 scores among Psyc 350 students Question #2: Psyc 350 students will do better on Exam #2 than on Exam #1 Stat: H0: RH: FWG Psyc 350 students will have the same mean on Exam #1 and Exam #2 Psyc 350 students will have the a higher mean on Exam #2 than on Exam #1
between groups comparisons (quant mean vs. qual pattern dif.) • Both of these stats can be applied to the data from a between groups design -- but which is used depends upon the kind of variable being compared r X2 FWGFBG • FBG-- is used when groups are being compared using a quantitative variable -- examination of mean differences • X2 -- is used to when the groups are being compared using a qualitative variable -- examination of response pattern differences • Example…(which stat for which?) … • Is whether or not patients receive therapy related to whether or not they improve ? • Is the mean anxiety different whether or not patients receive therapy? X2 FBG
Let’s take another look at this distinction... The question was whether different types of computers (PCs or Macs) had different “failure rates”. The RH: was that PCs would have a higher failure rate”. Two different researchers were hired to run experimental evaluations... Researcher #1 Acquired 50 computers of each type, had researcher assistants (working in shifts & following a prescribed protocol) keep each machine working continually for 24 hours & count the number of times each machine failed and was re-booted. Researcher #2 Acquired 50 computers of each type, had researcher assistants (working in shifts & following a prescribed protocol) keep each machine working continually for 24 hours or until it failed. • Data for each computer was: • type of computer • whether or not that computer failed during the 24 hr test • Data for each computer was: • type of computer • # failures during the 24 hr test H0: PCs will have same # failures as Macs RH: PCs will have more failures than MACs H0: Same # of PCs will have failures as Macs RH: More PCs will have failures than MACs FBG X2 Stat? Stat?
Your turn… The purpose of the research was to compare the efficacy of two therapies, with the RH: that cognitive-behavior therapy (CBT) would “work better” than peer-counseling therapy (PCT). Again two researchers ran independent projects. Researcher #1: 30 patients each received one type of therapy, after which their therapist determined whether or not they showed improvement. Stat: H0: RH: X2 Same number of patients will improve after each type of therapy. More of the patients taking CBT will improve than the patients taking PCT. Researcher #2: 30 patients each received one type of therapy, after which their score on the Beck Depression Inventory (BDI) was obtained. Stat: H0: RH: FBG Those patients taking CBT will have same mean BDI scores as those taking PCT. Those patients taking CBT will have same higher mean BDI scores as those taking PCT.
Summary of Information from Correlation, Chi-Square, BG & WG ANOVA Pearson’s r Pearson’s X² ANOVA Symbolic H0: Range of possible values Reject H0: when … Relationship Description H0: X1 = X2 0 to F > F-critical p < .05 direction of mean dif. H0: X² = 0 0 to X² > X²-critical or p < .05 specific pattern of relationship H0: r = 0 -1.00 to +1.00 |r| > r-critical or p < .05 direction of linear rel.
NHST Testing with critical-values & p-values |Obt| > Critical |Obt| < Critical oror. p < .05p > .05 Reject H0:Retain H0: NHST decision ? Decide relationship b/n variables in pop? YES NO Statistically Statistically significant^Non-significant* Results are ? ^ Remember: don’t say “meaningful” or “important” those are value judgements -- not a statistical description * Remember: don’t say “insignificant” that is a value judgement about the finding -- not a statistical description
Does Rejecting the Null Guarantee Support for the Research Hypothesis??? NO !!! For what two reasons …. 1) the RH: might be the H0: • is so, retaining H0: means support for the RH: 2) the RH: is only supported if it matches the pattern of the data • you can reject H0: and still not find support for the RH:
RH: Those with more experience will do better on the task. Results #1 r (87) = .032, p = .85 Well ? Retain H0: -- no support for RH: Results #2 r (87) = -.32, p = .03 Well ? Reject H0: -- but r is wrong direction Results #3 r (87) = .52, p = .01 Well ? Reject H0: -- and r is in correct direction
RH: The 4th graders will have higher geography scores than the 3rd graders Results #1 4th = 62% 3rd = 58% F(1,48) = 4.3, p = .02 Reject H0: -- mean dif in correct direction Results #2 4th = 62% 3rd = 60% F(1,18) = 2.3, p = .16 Retain H0: -- no support for RH: Results #3 4th = 62% 3rd = 68% F(1,28) = 5.3, p = .01 Reject H0: -- mean dif in wrong direction
RH: Clowns will prefer confetti, while jugglers will prefer “thuds” Result #1 X²(1) = 2.12, p = .25 clowns jugglers confetti 25 20 thuds 22 28 Retain H0: -- no support for RH: Result #2 X²(1) = 6.36, p = .02 clowns jugglers confetti 25 10 thuds 12 31 Reject H0: -- looks good for RH:!! Result #3 X²(1) = 6.12, p = .02 clowns jugglers confetti 14 10 thuds 15 31 Reject H0: -- only partial support for the RH:
You must distinguish “Statistical Decision Errors” vs. “RH: Disconfirmation” Type III Statistical Decision Error • When our significant findings have a direction or pattern different from that found in the population • A difference between “the effect we found” and “the effect we should have found” “Results contrary to our RH:” • When our findings have a direction or pattern different from what we had hypothesized • A difference between “the effect we found” and “the effect we hypothesized”
Outcomes & “Truth” ... In the population there are only three possibilities... … and three possible statistical decisions In the Population G1 < G2 G1 = G2 G1 > G2 Decisions G1 < G2 G1 = G2 G1 > G2 Type I error Correctly rejected H0: Type III error Type II error Type II error Correctly retained H0: Type I error Type III error Correctly rejected H0:
outcomes & RH: … and three possible statistical outcomes There are only three possible Research Hypotheses Research Hypotheses G1 < G2 G1 = G2 G1 > G2 Outcomes G1 < G2 G1 = G2 G1 > G2 ? ? ? ? ? ? ? ? So, there are only9 possible combinations of RH: & Outcomes … … of 3 types “effect as expected” “unexpected null/effect” “backward effect” ? ? ? ?
RH:, statistical conclusions & statistical decision errors ... Results supported Results not supported Statistical Decision + direction/pattern (p < .05) H0: (p > .05) - direction/pattern (p < .05 RH: + direction/pattern H0: -direction/pattern Correct rejection Type Ior Type III Correct rejection Type Ior Type III Correct rejection Type Ior Type III Correct retention orType II Correct retention orType II Correct retention orType II Correct rejection Type Ior Type III Correct rejection Type Ior Type III Correct rejection Type Ior Type III
Consider the following three pieces of information…Our RH: is that there will be a positive correlation between how much a person likes performing practical jokes and the number of close friends a person reports. We found r (58) = .30, p < .05. A literature review revealed 12 other studies of these two variables, each of which found a correlation between -.25 and -.32 (all p < .05). These results support our RH: -- a significant, positive relationship, as hypothesized The consistent findings of these other studies suggests that our finding was a Type III error – what we found “doesn’t describe the relationship between these variables in the population”
Try this one …Our RH: is that there will be a negative correlation between the severity of depression at the beginning of therapy and the amount of improvement a patient shows during the first six weeks of therapy. We found r (63) = .27, p = .035. A literature review revealed 34 other studies of these two variables, each of which found a correlation between -.33 and -.41 (all p < .05). These results are “contrary to our RH:” -- a significant, relationship in the opposite direction from the RH: The consistent findings of these other studies suggests that our finding was a Type III error – what we found “doesn’t describe the relationship between these variables in the population”. Our RH: was correct, but not our data!!!