Download
1 / 41
440 likes | 601 Vues
Climate change: Current status and future strategies for the Australian wine industry. Dr Leanne Webb University of Melbourne, Institute of Land and Food Resources and CSIRO Marine and Atmospheric Research. The 2010 Robyn van Heeswijck lecture. Outline of Presentation.

E N D
Climate change: Current status and future strategies for the Australian wine industry Dr Leanne Webb University of Melbourne, Institute of Land and Food Resources and CSIRO Marine and Atmospheric Research The 2010 Robyn van Heeswijck lecture
Outline of Presentation • Observed climate trends • Why is the climate changing? • Projected climate: 2°C global warming? • Impacts for wine industry • Phenology • Quality • Extreme events • Reduced water • Adaptation action for the wine industry • Geography/varieties- modelling approach • Management- learning from industry participants • Vineyard histories and forensics • Future plans • Summary
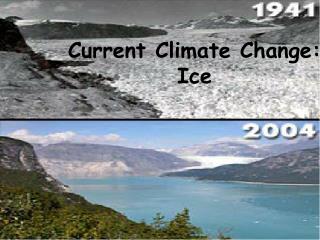
Observed global temperature changes “Warming of the climate system is unequivocal, as is now evident from observations of increases in global average air and ocean temperatures, widespread melting of snow and ice, and rising global average sea level” IPCC 2007
1970-2009 1950-2009 Observed changes in Australia Trend in Mean Temperature (°C/10 years) Increasing rate of change in mean temperature: Faster warming in later years 1910-2009
Annual Australian climate statement 2009 “Data collected by the Bureau of Meteorology indicate that Australia’s annual mean temperature for 2009 was 0.90°C above the 1961-90 average, making it the nation’s second warmest year since high-quality records began in 1910”. http://www.bom.gov.au/climate/current/index.shtml
2009: warmest year on record for South Aust. In 2009 the mean temperature was 1.3°C above average for South Australia as a whole, a record since the area averaged state figures begin in 1910. 1.5 Annual mean temperature anomaly for South Australia (base 1961-1990) 1 1910 0.5 Temperature Anomaly (°C) 0 -0.5 2009: the 17th consecutive year above average -1 -1.5 http://www.bom.gov.au/climate/current/index.shtml
2009: Notable climatic events for South Aust. • A very significant late January and early February heatwave event • The first spring heatwave for Adelaide as temperatures as a whole for November exceeded previous November temperature records by very significant margins. • Temperatures were also very much above average in mid-August. 4 November mean monthly temperature anomaly for South Australia (base 1961-1990) 3 2 1950 1 Temperature Anomaly (°C) 0 2009 -1 -2 -3 http://www.bom.gov.au/climate/current/index.shtml
March 2008. Adelaide experienced 15 days of 35°C plus temperatures. Based on the past 30 years, this could only be expected once in 3000 years. http://www.bom.gov.au/climate/current/statements/scs15b.pdf
Observed changes in Australia Trend in annual total rainfall (mm/10 years) 1970-2009 1950-2009 Noticeable trends: Drying over south-west WA. Increased rainfall over northern WA. Drying over Qld. Drying in the south-east. 1910-2009
The Drought Rainfall percentile ranking Highest on record 10 Very much above average 8-9 Above Average 4-7 Average 2-3 Below average Very much below average 1 Lowest on record Rainfall deciles for the six-year period Nov 2001-Oct 2007. Rainfall deciles for the 11-year period Nov 1996 - Oct 2007. Australian Bureau of Meteorology, 2008
Annual Australian climate statement 2009 Based on preliminary data, the overall Australian mean rainfall total for 2009 was 453 mm, slightly less than the long-term average (1961-90) of 464 mm. A dry year in the southeast and southwest of mainland Australia has prolonged the multi-year meteorological drought in those regions. Rainfall decile ranges http://www.bom.gov.au/climate/current/index.shtml
Outline of Presentation • Observed climate trends • Why is the climate changing? • Projected climate: 2°C global warming? • Impacts for wine industry • Phenology • Quality • Extreme events • Reduced water • Adaptation action for the wine industry • Geography/varieties- modelling approach • Management- learning from industry participants • Vineyard histories and forensics • Future plans • Summary
5. Greenhouse gases absorb some of this radiation, warming the lower atmosphere. This absorption of heat, which keeps the surface of our planet warm enough to sustain life, is called the greenhouse effect. 6. Without heat trapping gases in our atmosphere, the Earth’s surface temperature would be, on average, -18˚C rather than the +15˚C we currently experience. The Greenhouse Effect: It’s beneficial! 2. The rest is either reflected back into space by the atmosphere or absorbed by gases and dust particles. 1. About half of the sun’s energy reaching the top of our atmosphere penetrates to the Earth’s surface. 3. The solar energy that does reach the Earth’s surface warms the land and oceans. 4. The land and oceans release heat in the form of infrared radiation.
Past CO2 Concentrations 387.27ppm Dec 2009 (NOAA) CO2 - The Past 250 Years 380 CO2 - The Past 650,000 Years
Causes of global warming During the past 50 years, the sum of solar and volcanic forcing would likely have produced cooling. Observed patterns of warming and their changes since the mid-20th century are simulated only by models that include increase in anthropogenic greenhouse gas concentrations.” IPCC 2007
Outline of Presentation • Observed climate trends • Why is the climate changing? • Projected climate: 2°C global warming? • Impacts for wine industry • Phenology • Quality • Extreme events • Reduced water • Adaptation action for the wine industry • Geography/varieties- modelling approach • Management- learning from industry participants • Vineyard histories and forensics • Future plans • Summary
Enlargement of emissions graph: Focus 1990-2010 Raupach et al. 2007, PNAS. Climate change projections We are currently tracking the worst-case emissions scenario!
Projected global warming IPCC 2007
The Copenhagen accord • “To achieve the ultimate objective of the Convention to stabilize greenhouse gas concentration in the atmosphere at a level that would prevent dangerous anthropogenic interference with the climate system, we shall, recognizing the scientific view that the increase in global temperature should be below 2 degrees Celsius, on the basis of equity and in the context of sustainable development, enhance our long-term cooperative action to combat climate change”. (See: http://unfccc.int/files/meetings/cop_15/application/pdf/cop15_cph_auv.pdf )
Future storylines (Equivalent to 2°C global average warming) Coonawarra Warmer/small change to precip (8/23 models) For Coonawarra the climate projections indicate that the region will be warmer with reduced winter/spring rain (8/23 models). It is also possible that there is more drying (7/23 models) or perhaps a much hotter and much drier future (3/23 models). Coonawarra Much warmer/ much drier. (3/23 models) Coonawarra Warmer/drier (7/23 models)
Future storylines (Equivalent to 2°C global average warming) Marg River Warmer and drier (12/23 models) For Margaret River the climate projections indicate that the region will be warmer with reduced rain (12/23 models). It is also possible that there is less drying (6/23 models) or perhaps a bit more warming, and drier future (1/23 models). Marg River More warming/ drier. (1/23 models) Marg River Warmer/ less drying (6/23 models)
Future storylines (Equivalent to 2°C global average warming) Barossa Valley Warmer and drier (11/23 models) For Barossa Valley the climate projections indicate that the region will be warmer with reduced winter and spring rain (11/23 models). It is also possible that there is more drying (3/23 models) or perhaps a bit more warming and drying in the future (2/23 models). Barossa Valley More warming/ more drying (2/23 models) Barossa Valley Warmer/ more drying (3/23 models)
Outline of Presentation • Observed climate trends • Why is the climate changing? • Projected climate: 2°C global warming? • Impacts for wine industry • Phenology • Quality • Extreme events • Reduced water • Adaptation action for the wine industry • Geography/varieties- modelling approach • Management- learning from industry participants • Vineyard histories and forensics • Future plans • Summary
Impacts: phenology • A warmer climate will hasten the progression of phenological stages of the vine (e.g. budburst, flowering and veraison) so that ripening will occur earlier in the season. • Vintage, the period when grapes are harvested and processed in wineries, is likely to become more compressed requiring possible changes to winery infrastructure and vintage staffing levels. • Budburst in some of the more maritime climates may become uneven due to less chilling during the winter dormancy period. The big unknown: CO2
4.2 °C 2.5 °C Modeled impact on phenology A1B GHG emission scenario Mid climate sensitivity CSIRO Mk3 climate model
Impacts: quality • In most cases quality of existing mainstream winegrape varieties will be reduced if no adaptation measures are implemented • Alcohol levels increasing! • Consumer education relating to new wine styles and varieties will be important, e.g. the typical style for any given region is likely to change. THREE KEY MESSAGES FROM IMPACT STUDY: 1 Negative impact to winegrape quality (if no adaptive measures are implemented) 2 The impact varies regionally 3 Wine industry is sensitive to different warming scenarios (Assume no adaptation. Do not know [CO2] effects)
Impacts: extreme events • Heatwaves (SE Australia) • 2008 vintage: Harvest period • 2009 vintage: Veraison period • 2010 vintage: Flowering • Frost • earlier budburst • projections of lower rainfall, drier soils, fewer clouds and lower dew points • An increase in day-to-day climate variability • Extreme rain • Botrytis • erosion • Fire danger • Smoke taint Photo: B Collins
Impacts: water access/use • Water requirements for grapevines are likely to increase while at the same time rainfall and associated runoff to water storages is likely to decrease. (Etchells et al. 2009)
Outline of Presentation • Observed climate trends • Why is the climate changing? • Projected climate: 2°C global warming? • Impacts for wine industry • Phenology • Quality • Extreme events • Reduced water • Adaptation action for the wine industry • Geography/varieties- modelling approach • Management- learning from industry participants • Vineyard histories and forensics • Future plans • Summary
Present Climate Year 2030 mid warming Adaptation approach • Within regions, existing varieties can be replaced with ‘later season’ varieties to compensate for the warmer temperatures and compressed phenology. • Shifting to cooler sites will alleviate some warming impacts. As vineyard blocks have an average life of 30+ years, this option will need to be considered with some urgency. • Hayman/Leske climate change toolkit: higher resolution and more detail. Soil/topography/variety in combination!
State diversions for the Murray system (including lower Darling, and not adjusted for trade) Long Term Average Diversion • Autonomous adaptation: • Efficiency measures • Water purchasing www.mdbc.gov.au/__data/page/1366/Drought_Update_Issue_14_-_July_2008.pdf
Adaptation approach Greater participatory Adaptation study Partnership Degree of public participation in decisions • The most relevant options will be defined if scientists, growers and winemakers work together in ‘adapting’ to a changed climate. • This ‘adaptation’ process will be ongoing……… • AWITC workshop: Adaptation to Climate Change – what are we going to do? Involvement Consultation Impact study Gather information technocratic Inform/Educate Less Govt of Western Australia (2004)
Heatwave survey • Weather Awareness • Vineyard impact • Management strategies • Self assessment: what worked/ what didn’t 10 Regions X ~10 vineyards = 92 surveys
Heatwave Survey: outcomes A better understanding of the impact of hot temperatures on wine-grapes Cross-regional and inter-regional management guidelines for coping with hotter temperatures Documentation of what we have found http://www.landfood.unimelb.edu.au/vitum/Heatwave.pdf Publications and presentation Wine industry Scientific audience
Yield • Canopy management • Rainfall • Other (CO2)? • ~40ppm increase 8 Chardonnay Margaret River 2030 mid 0.6°C warming 16. Chardonnay Coonawarra 2030 mid 0.4°C warming Webb et al. (2008) Chardonnay: Mornington Peninsula (dry-grown) 38 days 13 days Ave GS Temp (°C) 0.77°C warmer
Average growing season temperature (°C) Dry grown Flood Travelling irrigator drip Vineyard forensics • 2 outcomes from analysis • Climate proxy work • Management effects on phenology Yield (t/ha)
Outline of Presentation • Observed climate trends • Why is the climate changing? • Projected climate: 2°C global warming? • Impacts for wine industry • Phenology • Quality • Extreme events • Reduced water • Adaptation action for the wine industry • Geography/varieties- modelling approach • Management- learning from industry participants • Vineyard histories and forensics • Future plans • Summary
Future plans: 10 regional workshops “It is not the strongest of the species that survives, nor the most intelligent, it is the one that is the most adaptable to change” Charles Darwin • We, as researchers, will work together with vineyard/ winery practitioners, to develop climate change adaptation strategies for vineyards in a top-down/bottom-up process. • In the light of the information we make available, the workshops aim to develop potential adaptive management options in response to climate change initiated scenarios (regionally targeted) such as heat wave occurrence and reduced water availability, potential new varietal mix.
Summary • It’s getting warmer • It’s getting drier in southern Australia • Temperature change and part of rainfall change (SWWA and potentially SEA) have been attributed to increasing greenhouse gases in the atmosphere • The Australian wine industry is being, and will be, affected • Adaptive responses are required to avoid adverse impact and take advantage of opportunities • Industry and researchers will work together to identify these responses • I believe, through implementation of identified strategies, the wine industry can survive and thrive
Acknowledgements • Robyn Van Heeswijck who’s life and world class research inspired this lecture series • Snow Barlow and Penny Whetton • GWRDC • VitUM colleagues and John Whiting (survey) • CSIRO (CMAR) colleagues (climate) • Amanda Able (University of Adelaide) • Industry practitioners (for help so far with the adaptation work): • 92 survey participants • Wineries for allowing access to records and other information