Remote Sensing for Reintroducing Mountain Bongos
A study on the habitat factors critical for mountain bongo conservation, using remote sensing and modeling techniques. The project aims to predict habitat changes and guide a reintroduction effort in Mount Kenya.

Remote Sensing for Reintroducing Mountain Bongos
E N D
Presentation Transcript
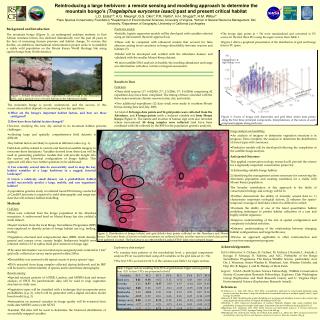
RS CF Tall herb layer & high canopy cover Tall forest, sparse understorey Bamboo Figure 1: Female mountain bongo captured on camera trap in the Aberdares (left), and a general view of forest habitat in the Aberdares (right). Short, open, shrubby Trees Figure 3: Scores of bongo (red diamonds) and grid (blue clubs) data points along the first three principal components. Interpretations of the nature of each component appear along each axis. Seasons 2 and 3 Mount Kenya Seasons 1 and 3 Season 3 ext. Seasons 1, 2, and 3 AberdareMountains Season 2 Season 1 Season 3 Seasons 1 and 2 Figure 2: Distribution of bongo (white) and grid (black) data points collected on the Aberdares and Mount Kenya. The lower limits of forests on both mountains are outlined in blue, and the seasons in which data points were gathered is noted. The backdrop is an orthorectified Landsat ETM+ false-color infrared image. Season 1 Table 1: Eigen vectors resulting from PCA of grid dataset. Eigen vectors greater than |0.3| in first 3 PCs are presented in bold. Background and Introduction The mountain bongo (Figure 1), an endangered antelope endemic to East African montane forests, has declined dramatically over the past 40 years in the face of increasing human pressure and habitat change. To reverse this decline, an ambitious international reintroduction project seeks to re-establish a viable wild population on the Mount Kenya World Heritage Site using captive bongo from North America. • Predictive models • Initially, logistic regression models will be developed with variables selected using an information theoretic approach (4). • These will be compared with enhanced models that account for false absences arising from variations in bongo detectibility between seasons and habitats (5). • Model will be developed and verified with the Aberdares dataset, and validated with the smaller Mount Kenya dataset. • If microsatellite DNA analysis is feasible, the resulting abundance and range size information will allow a richer ecological assessment. • The bongo data points (n = 56) were standardized and converted to PC scores for the first three PCs using the eigen vectors from Table 1. • Figure 3 offers a graphical presentation of the distribution of grid and bongo data in PC space. Reintroducing a large herbivore: a remote sensing and modeling approach to determine the mountain bongo’s (Tragelaphus euryceros isaaci) past and present critical habitatL.D. Estesa,b, A.G. Mwangic, G.S. Okind, P.R. Reilloa, H.H. Shugartb, H.M. WilburbaRare Species Conservatory Foundation, bDepartment of Environmental Sciences, University of Virginia, cSchool of Natural Resource Management, Moi University, dDepartment of Geography, University of California Los Angeles • Results to Date • Field data • Three field seasons (1st: 6-8/2005; 2nd: 2-3/2006; 3rd: 5-6/2006) comprising 92 expedition days have been completed. The timing of these coincided with the three major montane climatic seasons (rainy, dry, and misty). • Two additional expeditions (12 days total) were made to southern Mount Kenya during June and July, 2006. • A total of 56 bongo data points and 94 grid pointswere collected from the Aberdares, and 8 bongo points (with a reduced variable set) from Mount Kenya (Figure 2). The nature and location of human sign were also recorded where encountered. 88 dung samples were collected (and have been combined with 144 collected by the BSP for the population genetics analysis). Many slender trees The mountain bongo is poorly understood, and the success of this conservation effort depends on answering two key questions: • What are the bongo’s important habitat factors, and how are these configured? • How have these habitat factors changed? However, studying this rare, shy animal in its mountain habitat presents challenges: • Image analysis and modelling • An analysis of imagery to determine vegetation structure is in progress. Once complete, the analysis to determine the distribution of forest types will commence. • Predictive models will be developed following the completion of the satellite image analysis. • collecting large and spatially comprehensive field datasets is difficult; • key habitat factors are likely to operate at different scales (e.g. 1). • Field data will be related to current and historical satellite imagery to overcome these limitations. Variables derived from these data will be used in generating predictive models that will provide insight into the current and historical configuration of bongo habitat. This approach will allow two further questions to be addressed: • 1) Can remotely sensed data be successfully used to map the key habitat variables of a large herbivore in a rugged, forested landscape? • 2) Given a relatively small dataset, can a probabilistic habitat model successfully predict a large, mobile, and rare organism’s habitat? • A population genetics study of collected faecal DNA being conducted at Cardiff University is expected to yield demographic and range size data that will enhance habitat modelling. • Anticipated Outcomes • This applied conservation ecology research will provide the science for a regionally important conservation project by: • 1) delineating suitable bongo habitat; • 2) identifying the management actions necessary for conserving the Aberdares population and creating conditions for a viable wild Mount Kenya population. • The broader contribution of this approach to the fields of conservation biology and ecology will be to: • Further demonstrate the ability of remotely sensed data to: 1) characterize important ecological factors; 2) enhance the spatio-temporal coverage of field data where it is difficult to collect; • Evaluate the ability of one of the latest quantitative habitat modeling techniques to predict habitat utilization of a rare and highly mobile organism; • Improve understanding of the role of spatial configuration and complexity in habitat selection; • Enhance understanding of the relationship between changing habitat configurations and large herbivores; • Devise an approach applicable to other reintroduction and ecosystem management programs. • Methods • Field data • Data were collected from the bongo population in the Aberdare mountains. A rediscovered herd on Mount Kenya has also yielded a small dataset. • Expert trackers from the local Bongo Surveillance Programme (BSP) were employed to identify points of bongo habitat use (e.g. feeding, resting). • Vegetation structural and compositional data (DBH, shrub density, ground and canopy cover, canopy height, herbaceous height) were collected within 11.3 m radius fixed plot centered on bongo sign. Acknowledgements Field collaboration: S. Gichure, K. Gichuri, M. Gichuri, J. Kariuki, L. Kariuki, J. Korage, P. Mwangi, B. Nderitu, and M.G. Prettejohn of the Bongo Surveillance Programme. The Kenya Wildlife Service, particularly Asst. Dir. J. Warutere, Senior Warden K. Wambani, Asst. Warden Gichohi, and Dep. Dir. R. Bagine. J. and H. Henley of Honi Farm. Support: NASA (Earth System Science Fellowship), Wildlife Conservation Society (Conservation Research Fellowship), Explorers Club Washington Group (Exploration and Field Research Grant), and U. Virginia Dept. Environmental Science (Exploratory Research Award). • Exploratory data analysis • To examine data patterns at the microhabitat level, a principal components analysis (PCA) was performed using all 8 variables on the grid data set (n = 94). • The first 3 PCs account for 66 % of the variance (see Table 1 for eigen vectors). • The same information was recorded at pre-assigned points centered in 1 km2 grid cells, collected as survey tracks passed within 200 m. • Detectibility was assessed with repeat counts of proxy species’ sign. • DNA extracted from dung samples collected during fieldwork and by BSP will be used to confirm identity of species and to determine demography. • Remote sensing • Spectral mixture analysis of ASTER, Landsat, and MODIS data and texture analysis of SPOT 5m panchromatic data will be used to map vegetation structure in study area. • Vegetation types will be classified with a technique that incorporates prior probabilities (e.g. 2), which will be generated with a digital elevation model based model (e.g. 3). • Information on seasonal variation in forage quality will be extracted from multi-date MODIS scenes with NDVI. • Landsat TM data will be used to determine the historical distribution of successfully mapped variables. References (1) Johnson, C. J., Seip, D.R., Boyce, M.S. 2004. A quantitative approach to conservation planning: using resource selection functions to map the distribution of mountain caribou at multiple spatial scales. J Appl Ecology 41:238-251. (2)Horsch, B. 2003. Modelling the spatial distribution of montane and subalpine forests in the central Alps using digital elevation models. Ecological Modelling 168:267-282 (3)Pedroni, L. 2003. Improved classification of Landsat Thematic Mapper data using modified prior probabilities in large and complex landscapes. International Journal of Remote Sensing 24(1):91-113. (4)Burnham, K.P., Anderson, D.R. 2002. Model Selection and Multi-Model Inference: A Partical Information Theoretic Approach (2nd Ed.). Springer-Verlag, New York. 488 pp. (5)MacKenzie, D.I., Nichols, J.D., Royle, J.A, Pollock, K.H., Bailey, L.L., Hines, J.E. 2006. Occupancy Estimation and Modeling: Inferring Patterns and Dynamics of Species Occurrence. Elsevier, London. 324 pp.