Download

1 / 0
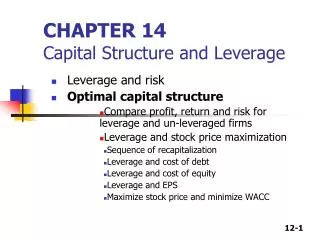
Chapter 14 Capital Structure and Leverage
10 likes | 244 Vues
Chapter 14 Capital Structure and Leverage. Background. Capital structure - mix of a firm’s debt and equity In this chapter preferred stock is considered debt Financial Leverage - using borrowed money to multiply the effectiveness of equity
Télécharger la présentation 
Chapter 14 Capital Structure and Leverage
An Image/Link below is provided (as is) to download presentation
Download Policy: Content on the Website is provided to you AS IS for your information and personal use and may not be sold / licensed / shared on other websites without getting consent from its author.
Content is provided to you AS IS for your information and personal use only.
Download presentation by click this link.
While downloading, if for some reason you are not able to download a presentation, the publisher may have deleted the file from their server.
During download, if you can't get a presentation, the file might be deleted by the publisher.
E N D
Presentation Transcript
- Chapter 14 Capital Structure and Leverage
- Background Capital structure - mix of a firm’s debt and equity In this chapter preferred stock is considered debt Financial Leverage - using borrowed money to multiply the effectiveness of equity Financial leverage of 10% means the capital structure is 10% debt and 90% equity
- The Central Issue Can the use of debt (leverage) increase the value of a firm’s equity? Can it increase stock price? Under certain conditions changing leverage can increase stock price But an increase in leverage also increases risk
- Risk in the Context of Leverage Leverage influences stock price Measures of overall performance EBIT (Earnings Before Interest and Taxes) Return on Equity (ROE) is Earnings per Share (EPS) is
- Redefining Risk for Leverage-Related Issues Leverage-related risk is variation in ROE and EPS Business risk — variation in EBIT Financial risk — additional variation in ROE and EPS due to financial leverage Total risk is total variation in ROE and EPS
- Figure 14-1 Business and Financial Risk
- Leverage and Risk Two Kinds of Each Financial Leverage Associated with capital structure Causes financial risk. Operating Leverage Associated with cost structure, the firm’s mix of fixed and variable cost Influences a firm’s business risk => variation in EBIT
- Financial Leverage Financial leverage may increase stock price Can improve financial performance, as measured by ROE and EPS May make performance worse Always increases risk
- Table 14-1 Effect of Increasing Financial Leverage when Return on Capital Exceeds After-Tax Cost of Debt Replacing equity with debt reduces Net Income due to interest expense. But if profitability is good, it reduces equity and number of shares faster than the decline in Net Income. Hence as debt increases, both EPS and ROE rise dramatically.
- Effect Of Increased Leverage On Stock Price In Good Times Based on ROE and EPS performance in good times, investors bid stock price up as debt is increased from low levels Effect is eventually mitigated by the increasing financial risk from leverage Under what conditions will increasing leverage improve ROE and EPS?
- When Might Financial Leverage Help? Return on Capital Employed Measures the profitability of operations before financing charges but after taxes on a basis comparable to ROE When the ROCE > the after-tax cost of debt, more leverage improves ROE and EPS When ROCE < the after-tax cost of debt, more leverage makes ROE and EPS worse
- Table 14-2 Effect of Increasing Financial Leverage when After-Tax Cost of Debt Exceeds Return on Capital When ROCE is less than the after tax cost of debt, increasing leverage reduces EPS and ROE . That, along with increasing risk, has a very negative effect on investors and stock price falls.
- Concept Connection Example 14-1Managing EPS through Leverage Will borrowing more money and retiring stock raise Albany’s EPC, and if so, what capital structure will achieve an EPS of $2?
- Concept Connection Example 14-1Managing EPS through Leverage
- Concept Connection Example 14-1Managing EPS through Leverage
- Managing Through Leverage Under certain conditions management may be able to manipulate financial results and stock price by changing the firm’s capital structure. This is true, but must be done cautiously
- An Alternate Approach (Optional) Using ratios and information from financial statements to solve for unknown values: algebraic approach EPS = ROE × Book Value per share ROE = Net Income ÷ Equity Net Income= [EBIT – Interest] (1 – tax rate) Interest = kd (Debt) Net Income = [EBIT – (kd)(Debt)](1 – tax rate) Equity = Total Capital – Debt
- Table 14-3 Financial Leverage and Risk Financial leverage is a two-edged sword Multiplies good results into great results Multiplies bad results into terrible results
- Putting the Ideas Together—The Effect on Stock Price During periods of good performance, leverage enhances results in terms of ROE and EPS Leverage adds variability (risk) to financial performance when operating results change These effects push stock prices in opposite directions
- Real Investor Behavior and the Optimal Capital Structure When leverage is low, an increase has a positive effect on investors At high debt levels, risk concerns overwhelm benefit of enhanced performance thus additional leverage decreases stock price As leverage increases, its effect goes from positive to negative
- Figure 14-2 The Effect of Leverage on Stock Price
- Finding the Optimum—A Practical Problem 1. A firm with good profit prospects and little or no debt is probably missing an opportunity by not using borrowed money if interest rates are reasonable. 2. For most businesses, the optimal capital structure is somewhere between 30% and 50% debt. 3. Debt levels above 60% create excessive risk and should be avoided.
- The Target Capital Structure A firm’s target capital structure is management’s estimate of the optimal capital structure
- The Effect of Leverage When Stocks Aren’t Trading at Book Value Changes in leverage not involving the purchase of equity at book value are more complex Repurchasing stock for retirement at prices other than book value will have the same general impact on ROE, but not necessarily for EPS EPS = ROE x (book value per share)
- The Degree of Financial Leverage (DFL)A Measurement Financial leverage magnifies changes in EBIT into larger changes in ROE and EPS DFL quantifies the effectiveness of leverage by relating relative changes to EPS and EBIT
- EBIT- EPS Analysis Provides a visual/graphic representation of effect of leverage on EPS Helps managers analyze and quantify the tradeoffs between risk and results when deciding on leverage policy
- Figure 14-3 EBIT – EPS Analysis for ABC Corp (from Table 14.1, Columns 1 and 2) For the Arizona Balloon Corporation the 50% Debt and No Leverage lines intersect. At the point of intersection ABC is indifferent between the two leverage options. To the right of the intersection, where EBIT is above $100,000, the 50% Debt plan is preferable, but to the left the company is better off without leverage. It is important to determine the indifference point, which occurs when the two plans offer the same EBIT.
- Operating Leverage Terminology and Definitions “Operations” - a firm’s business activities excluding long-term financing Income statement items from sales through EBIT Risk in Operations — Business Risk Variations in EBIT due to many reasons (sales, costs, management)
- Fixed Costs Don’t change with the level of sales Include rent, depreciation, utilities, salaries Variable Costs Change with the level of sales Include direct labor, direct materials, sales commissions Operating Leverage Fixed and Variable Costs and Cost Structure Cost Structure – the mix of fixed and variable costs in a firm’s operations
- Breakeven Analysis Determines the level of activity a firm must achieve to stay in business in the long run Shows the mix of fixed and variable costs and the volume required for zero profit/loss
- Figure 14-4 Fixed, Variable, and Total Cost
- Figure 14-5 The Breakeven Diagram Breakeven occurs at the intersection of revenue and total cost, QB/E
- Breakeven Analysis The Contribution Margin Every sale makes a contribution of the difference between price (P) and variable cost (V) Ct = P – V Can be expressed as a percentage of revenue Known as the contribution margin (CM) CM = (P – V) P
- Concept Connection Example 14-4Contribution Suppose a company can make a unit of product for $7 in variable labor and materials, and sell it for $10. What are the contribution and contribution margin? The contribution per unit is Ct = P – V = $10 - $7 = $3 while the contribution margin is: Cm = P – V P = $3 / $10 = 0.3 = 30%
- Breakeven Analysis Calculating the Breakeven Sales Level EBIT = PQ – VQ – FC Breakeven occurs when EBIT = 0 or revenue (PQ) equals total cost (VQ + FC). Then solve for QB/E Breakeven shows how many units must be sold to pay for (cover) fixed costs Can be expressed in terms of dollar sales
- Concept Connection Example 14-5 Breakeven What is the breakeven sales level in units and dollars for a company that can make a unit of product for $7 in variable costs and sell it for $10, if the firm has fixed costs of $1,800 per month? The breakeven point in units is $1,800 ($10 - $7) = 600 units. The breakeven point in dollars is $10 per unit times 600 units, or $6,000, which could also be calculated as $1,800 / 0.30. Thus, the firm must sell 600 units per month to cover fixed costs.
- The Effect of Operating Leverage As volume moves away from breakeven, profit or loss increases faster with more operating leverage The Risk Effect More operating leverage leads to larger variations in EBIT, or business risk The Effect on Expected EBIT When a firm is operating above breakeven, more operating leverage implies higher operating profit
- Figure 14-6 Breakeven Diagram at High and Low Operating Leverage
- Concept Connection 14-6 The Effect of Operating Leverage Suppose the low-leverage firm in Figure 14-6a has fixed costs of $1,000 per period, sells its product for $10, and has variable costs of $8 per unit. Further suppose that the high-leverage firm in Figure 14-6b has fixed costs of $1,500 and also sells its product for $10 a unit. Both firms are at the same breakeven point. What variable cost must the high-leverage firm have if it is to achieve the same breakeven point as the low-leverage firm? State the trade-off at the breakeven point. Which structure is preferred if there’s a choice?
- Concept Connection Example 14-6 The Effect of Operating Leverage Both firms have a breakeven point of 500 units (Low-leveraged firm: $1,000 $2). We need to solve the breakeven formula for the high-leveraged firm’s variable costs per unit: QB/E-a = FC (P – Va) = 500 units QB/E-b = FC (P – Vb) = 500 units 500 units = $1,500 ($10 – Vb) Vb = $7 AndCt = $10 - $7 = $3 The preferred structure depends on volatility—if sales are expected to be highly volatile, the lower fixed cost structure might be better in the long run. At breakeven, a $1 differential in contribution makes up for a $500 difference in fixed cost.
- The Degree of Operating Leverage (DOL)—A Measurement Operating leverage amplifies changes in sales volume into larger changes in EBIT DOL relates relative changes in volume (Q) to relative changes in EBIT
- Concept Connection Example 14-7 Degree of Operating Leverage (DOL) The Albergetti Corp. sells its product at an average price of $10. Variable costs are $7 per unit and fixed costs are $600 per month. Evaluate the degree of operating leverage when sales are 5% and then 50% above the breakeven level. First, compute the breakeven volume: $600 ($10 - $7) = 200 units. Breakeven plus 5% is 200 x 1.05 or 210 units, while breakeven plus 50% is 200 x 1.50 or 300 units. DOL at 210 units is: DOL at 300 units is: Note that DOL decreases as the output level increases above breakeven.
- Financial Leverage involves substituting debt for equity in the firm’s capital structure Is more controllable than operating leverage Operating Leverage involves substituting fixed costs for variable costs in the firm’s cost structure Comparing Operating and Financial Leverage Both can enhance results while increasing variation Both involve substituting fixed cash outflows for variable cash outflows Both make their respective risks larger as levels of leverage increase
- Figure 14-7 The Similar Functions of Operating and Financial Leverage
- Figure 14-8 Risk and Cost Relationships between Operating and Financial Leverage
- The Compounding Effect of Operating and Financial Leverage Effects of financial and operating leverage compound one another Changes in sales are amplified by operating leverage into larger relative changes in EBIT Changes in EBIT are amplified by financial leverage into larger relative changes in ROE and EPS Result: Modest changes in sales can lead to dramatic changes in ROE and EPS Combined effect is measured by DTL, the degree of total leverage DTL = DOL × DFL
- Figure 14-9 The Compounding Effect of Operating Leverage and Financial Leverage
- Capital Structure Theory Does capital structure affect stock price and the market value of the firm? If so, is there an optimal structure that maximizes either or both? Capital structure does impact stock prices There is an optimal But no precise way to find it
- Background The Value of the Firm Notation Vd = market value of the firm’s debt Ve = market value of the firm’s stock or equity Vf = market value of the firm in total Vf = Vd + Ve Investors’ returns on the firm’s securities will be kd = return on an investment in debt ke = return on an investment in equity The average cost of capital is a weighted average of the costs of debt and equity ka = average cost of capital
- Background The Value of the Firm Value is based on cash flow, which comes from income Dividends and interest payments are both perpetuities The firm’s market value is the sum of its present values Operating income = And Returns drive value in an inverse relationship.
- The value of the firm and the firm’s stock price each reach maxima when the average cost of capital is minimized. Figure 14-10 Variation in Value and Average Return with Capital Structure
- The Early Theory by Modigliani and Miller (MM) Restrictive Assumptions in Original Model The 1958 MM paper on capital structure included numerous restrictions such as No income taxes Securities trade in perfectly efficient capital markets with no transaction costs No costs to bankruptcy Investors and companies can borrow as much as they want at the same rate
- The Early Theory by Modigliani and Miller (MM) The Assumptions and Reality Income taxes exist Bankruptcy costs are quite high Individuals cannot borrow at the same rate as companies and Interest rates usually rise as more money is borrowed
- The Early Theory by Modigliani and Miller (MM) The result The independence hypothesis: value is independent of capital structure As cheaper debt is added, the cost of equity increases because of increased risk Arbitrage concept Interpreting the result
- Figure 14-11 The Independence Hypothesis (a)
- Figure 14-11 The Independence Hypothesis (b)
- Relaxing the Assumptions—More Insights Financing and the U.S. Tax System Tax system favors debt financing over equity financing Including Corporate Taxes in the MM Theory Interest provides a tax shield that reduces government’s share of the firm’s earnings Value is increased by the PV of the tax shield. The benefit of debt is the tax rate times the debt amount. The benefit of debt accrues entirely to stockholders since bond returns are fixed.
- Table 14-4 The Tax System Favors Debt Financing 58
- Tax Shield Interest is tax deductible, so if there’s debt and an amount of interest, I, the government gets T(OI − I) = T(OI) − TI PV of tax shield is
- Figure 14-12 MM Theory with Taxes In the MM model with taxes, value increases steadily as leverage is added. Thus, the firm’s value is maximized with 100% debt. Note that kd remains constant across all levels of debt.
- Including Bankruptcy Costs in the MM Theory As leverage increases past a certain point, concern about bankruptcy losses increases Debt and equity investors raise required returns ka passes its minimum as price and value peak Hence value and price are maximized at an optimal capital structure where the average cost of capital is a minimum
- Figure 14-13 MM Theory with Taxes and Bankruptcy Costs
- An Insight into Mergers and Acquisitions In many mergers, a firm buys the stock of a target company at a premium over its market price/value If the target was undervalued due to lack of debt, the increase in value from adding leverage may be more than the premium paid for the target’s stock


More Related