MRP and Related Concepts
480 likes | 1.18k Vues
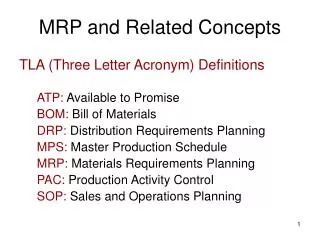
MRP and Related Concepts. TLA (Three Letter Acronym) Definitions ATP: Available to Promise BOM: Bill of Materials DRP: Distribution Requirements Planning MPS: Master Production Schedule MRP: Materials Requirements Planning PAC: Production Activity Control

MRP and Related Concepts
E N D
Presentation Transcript
MRP and Related Concepts TLA (Three Letter Acronym) Definitions ATP: Available to Promise BOM: Bill of Materials DRP: Distribution Requirements Planning MPS: Master Production Schedule MRP: Materials Requirements Planning PAC: Production Activity Control SOP: Sales and Operations Planning
Master Scheduling I • Controls the timing and quantity of production for products or product families • Primary interface point for actual customer orders • Coordinates forecasted demand and actual orders with production activity • Serves as tool for agreement between marketing and operations (but at a different level than SOP)
Master Scheduling II • Feeds more detailed material planning • Indicates the quantity and timing (i.e., delivery times) for a product or group of products • More detailed than SOP • weekly versus monthly • specific products versus “average” • must satisfy the needs of marketing • must be feasible for operations
Link between SOP and MPS Month: January February March Output: 200 300 400 SOP January (weeks) 1 2 3 4 Push Mowers 25 25 25 25 Self-propelled 35 40 Riding 12 13 MPS
MPS Formulas: Definitions • ATPt = Available to promise in period t • EIt = Ending Inventory for period t (same as projected on-hand inventory for next period) • Ft = Forecasted demand for period t • MPSt = MPS quantity available in period t • OBt = orders booked for period t
Detailed MPS for Widgets • Notes: • Planning time fence cumulative lead time for product • What seems to be the lot-sizing rule here?
Projected On-Hand Inventory i.e. Projected on-hand inventory for week 47: = 65 + 300 – 150 = 215
Available-to-Promise 120 ATP(45) = 100 + 300 – (170 + 165) = 65 ATP(47) = 300 – (140+120) = 40 ATP(49) = 250 – (85 + 45) = 120
Change in Forecast Demand Are we in trouble yet?
Change in Orders Booked Note impact of ATP(45) and on-hand inventory projections
Key Points about MPS • Provides more detail than SOP • Tracks the following information: • Actual versus forecasted demand • Available-to-Promise • This gives sales information for accepting or not accepting new orders for delivery in a given week
A Final View of Master Scheduling SOP Marketing Operations MPS Rough-Cut Capacity Plan
Material Requirements Planning • MRP in the planning cycle • The logic of MRP • an extended example • Considerations of MRP
Assume that we’ve scheduled 500 chairs to be ready five weeks from now. . . . Now what?
Material Needed for a Chair Side rails (2) Seat Front legs (2) Cross bars (2) Back supports (3)
Chair Seat Leg Assembly Back Assembly Back Supports (3) Cross bar Side rails (2) Cross bar Legs (2) Chair Structure Tree(aka “Bill of Materials”)
Graphic Lead-Time Week 1 Week 2 Week 3 Week 4 Week 5 Back Support (2 weeks) Back Assembly Side Rails (2 weeks) Cross Bar (2 weeks) (1 week) Chair Assembly Seats (2 weeks) (1 week) Leg Assembly Legs (2 weeks) Cross Bar (2 weeks) (1 week)
Lead-Time Key Points • To have finished chairs at the beginning of Week 5, we must begin production and order materials in Week 1. • “Exploding” the bill of materials tells us when to order things. • Not much we can do to adjust output of chairs for the next 4 weeks. Why?
Material Requirements Planning (MRP) We need the following inputs: • Bill-of-Materials (BOM) • Inventory records • Master production schedule We’ll get the following outputs: • What items should be ordered • When each item should be ordered • How much of each should be ordered
The MRP Process Starts with the MPS End items are also known as “Level 0” items
The “Parent / Child” Relationship Where do the gross requirements come from? Do you understand the MRP logic?
Going Deeper… 25 25 25
Moving from “Level 1” itemsto “Level 2” items . . . 25 25 25 Where do the gross requirements for LEGS come from?
Combining Requirements: “Cross Bars” 25 25 25 Note effect of differences in lead times and order sizes on the gross requirements for each component
Impact of Longer Lead Times We cannot do this since the planned order would be in the past…. Thus the 250 crossbars will be delivered late one week to back assembly. What does this do to our chair schedule? 25 25 25
Do You Understand ... • Why it is important to have an accurate BOM and accurate inventory information? • Why do we need to “freeze” production schedules? • Where do gross requirements come from? • The is the difference between planned and scheduled receipts?
Other Considerations I MRP Feedback Feedback Planned Orders Suppliers Production
Other Considerations II • When do we update the system? • Capacity requirements planning using MRP output • “Pegging” • Lot sizing issues
Recall ... 25 25 25 Look at the “lumpiness” of demand for legs
If we order “lot-for-lot” 25 25 25 Much smoother demand for legs, lower average inventory
Distribution Requirements Planning (DRP) • Anticipates downstream demand • Uses this information, not predetermined reorder points or periodic reviews, to determine when to order • Computer-based software systems needed to deal with the added complexity
DRP Example I Suppose we forecast demand for Wholesaler A for the next 8 days (the best time horizon to use will depend on many factors) Based on this, we anticipate that Wholesaler A will order on Day 3
DRP Example II We extend the analysis to include Wholesaler B Combined, we expect to see orders on Days 3 and 4
DRP Example III The distributor then uses this information to plan its own orders. In this case, suppose it takes two days for the supplier to replenish; based on the information, the distributor would order on Day 1
DRP Benefits • Helps improve customer service • Provides a better and faster understanding of the impact of shortages and/or promotions • Helps reduce costs • Inventory • Freight • Production • Provides integration between the stages in the supply chain
DRP Constraints • Accurate forecasts and inventory levels • Necessary to anticipate correctly when orders will be placed • Consistent and reliable lead times • To ensure that orders can be placed and arrive by the time they are needed • “Nervousness” • Even slight changes in demand for downstream partners can have a significant impact on order volumes, especially when order sizes are relatively high