Global Supply Chain Management
Global Supply Chain Management. Global Supply Chain Management. Global Supply Chain Management. Global Supply Chain Management. Inventory Reduction Tactics Reduce lot sizes Improved demand forecasts Reduce lead times Reduce supply uncertainties R = dL + Z s sqrt(L).

Global Supply Chain Management
E N D
Presentation Transcript
Global Supply Chain Management Inventory Reduction Tactics Reduce lot sizes Improved demand forecasts Reduce lead times Reduce supply uncertainties R = dL + Z s sqrt(L)
Global Supply Chain Management • Themes • Supplier Consolidation / Purchasing and Procurement • RFID • VMI • Green • Information Technology • Lean • Pull
Global Supply Chain Management Purchasing / Procurement How can we double profits to $1,000,000? Total Sales = $10,000,000 Purchased Materials = 7,000,000 Labor and Salaries = 2,000,000 Overhead = 500,000 Profit = 500,000
Global Supply Chain Management • Purchasing / Procurement • Important Practices • Leverage buying power • Commit to small number of dependable suppliers • Partner with suppliers to reduce total cost
Global Supply Chain Management • Supply Chain Management • Some Lingo • Some Global Issues • The Bullwhip Effect in Supply Chains • Information Technology • Improvement Ideas • Cases
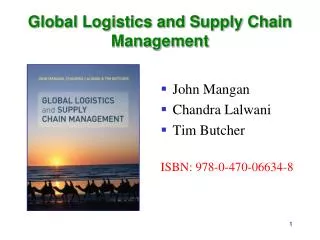
Global Supply Chain Management Factors to be considered when moving from (mostly) domestic chains to global ones
Global Supply Chain Management HP and DeskJet Background. Problems and Goals. Potential Solutions. HP Solution.
800 600 400 200 Bullwhip Effect due to Seasonal Sales of Campbell Soup 0 Shipments from Manufacturer to Distributors Order Quantity Retailers’ Sales 1 Weeks 52 Global Supply Chain Management Results:
Global Supply Chain Management • Supply Chain Management Systems (SCM): Automate flow of information between firm and suppliers to optimize production and delivery • Supply Chain Management: Close linkage of activities involved in buying, making, moving a product • Supply Chain: Network of organizations and business processes for production and distribution of products
Global Supply Chain Management • Information Systems Can Help Supply Chain Participants:
Global Supply Chain Management • Information Technology
Global Supply Chain Management Inbound Production Outbound Sales and Customer logistics processes logistics marketing service Information Technology Upstream Downstream
Global Supply Chain Management Logistics • Most supply chains use inter-modal transportation, multiple transportation channels (railway, truck, etc) to move products from origin destination • This creates supply chain complexities
Global Supply Chain Management • Fulfillment • Logistics • Production • Revenue and profit • Cost and price • Cooperation among SC partners GOALS
Global Supply Chain Management A Good SCM System will help a firm • Decide when and what to produce, store, and move • Rapidly communicate orders • Track the status of orders • Check inventory availability and monitor inventory levels • Reduce inventory, transportation, and warehousing costs • Track shipments • Plan production based on actual customer demand • Rapidly communicate changes in product design
Global Supply Chain Management Identify the problem(s) Haworth was facing. What alternative solutions were available to management? How well did the chosen solution work? What people, organization, and technology issues need to be addressed?
Global Supply Chain Management Additional SCM Resources • i2 Technologies – www.i2.com • Manugistics • Supply Chain Knowledge Base – supplychain.ittoolbox.com • Supply Chain Management Review – www.scmr.com • CIO Magazine – www.cio.com • About Inc. (Logistics/Supply Chain) – logistics.about.com • IBM - http://www-03.ibm.com/solutions/businesssolutions/scm/index.jsp • Oracle/PeopleSoft Supply Chain – www.oracle.com/applications/scm • Institute for Supply Chain Management – www.ism.ws
Global Supply Chain Management Inventory Management • Concepts • Weeks of supply • Turns • ABC Analysis • Q System • Q Systems Total Costs • P System • Q System vs. P System
Global Supply Chain Management • Inventory is a stock of anything held to meet some future demand. It is created when the rate of receipts exceeds the rate of disbursements. • A stock or store of goods. • Inventory Turns (Turnover) COGS/Avg. Inventory Investment
Global Supply Chain Management • Weeks of supply = Average aggregate Inventory Value / Weekly Sales (at cost) • IT = COGS / Average aggregate inventory value • The Eagle Machine Company averaged $2M in inventory last year, and the COGS was $10M. If the company has 52 business weeks per year, how many weeks of supply are held in inventory? What is the inventory turnover rate?
Class C Class B 100 — 90 — 80 — 70 — 60 — 50 — 40 — 30 — 20 — 10 — 0 — Class A Percentage of dollar value 10 20 30 40 50 60 70 80 90 100 Percentage of SKUs Global Supply Chain Management
Global Supply Chain Management Booker’s Book Bindery divides SKUs into three classes, according to their dollar usage. Calculate the usage values of the following SKUs and determine which is most likely to be classified as class A.
Global Supply Chain Management Fixed Quantity Model, Q Continuous Review System Order a fixed amount Order cycle (time between orders) varies EOQ, C (holding and ordering costs) R - Constant demand, constant lead time - Variable demand~N, constant lead time Fixed Interval Model, P Periodic Review System Order various amounts Order cycle is fixed or constant
Global Supply Chain Management Constant demand, constant lead time. EOQ=Economic Order Quantity Q=Order Quantity D=Annual demand S=Order cost per order H=Annual holding cost per unit TC=Total annual costs TBO=Time between orders, order cycle time R=Reorder Point, used when LT>0 d=demand rate, dbar mean demand rate L=Lead time Constant means fixed or non-fluctuating.
Receive order Inventory depletion (demand rate) Q Q — 2 On-hand inventory (units) Average cycle inventory 1 cycle Time Global Supply Chain Management Constant demand, constant lead time.
IP IP IP Order received Order received Order received Order received On-hand inventory OH OH OH R Order placed Order placed Order placed Time L L L TBO TBO TBO Global Supply Chain Management
Global Supply Chain Management Ex: Find EOQ, TBO, and make cost comparisons Constant demand, constant lead time, LT=0. Suppose that you are reviewing the inventory policies on an item stocked at a hardware store. The current policy is to replenish inventory by ordering in lots of 360 units. Additional information given: D = 60 units per week, or 3120 units per year S = $30 per order H = 25% of selling price, or $20 per unit per year
Global Supply Chain Management Ex: Determine ROP Constant demand, constant lead time, LT>0. Q=300 units, LT=8 days, TBO=30 days.
IP IP IP Order received Order received Order received Order received On-hand inventory R Order placed Order placed Order placed 0 Time L1 L2 L3 TBO1 TBO2 TBO3 Global Supply Chain Management
Average demand during lead time R zσdLT Global Supply Chain Management Cycle-service level = 85% Probability of stockout (1.0 – 0.85 = 0.15)
Global Supply Chain Management Ex: Determine EOQ, ROP Q System Variable demand~N, constant lead time, LT>0. The Discount Appliance Store uses a fixed order quantity model. One of the company’s items has the following characteristics: Demand = 10 units/wk (assume 52 weeks per year, normally distributed) Ordering and setup cost (S) = $45/order Holding cost (H) = $12/unit/year Lead time (L) = 3 weeks Standard deviation of demand = 8 units per week Service level = 70%
T IP IP IP Order received Order received Order received Q3 Q1 OH Q2 OH IP1 On-hand inventory IP3 Order placed Order placed Order placed IP2 Time L L L P P Protection interval Global Supply Chain Management Periodic Review System (P)
Global Supply Chain Management The on-hand inventory is 10 units, and T is 400. There are no back orders, but one scheduled receipt of 200 units. Now is the time to review. How much should be reordered?
Global Supply Chain Management Calculating P and T Demand for the bird feeder is normally distributed with a mean of 18 units per week and a standard deviation in weekly demand of 5 units. The lead time is 2 weeks, and the business operates 52 weeks per year. The Q system called for an EOQ of 75 units and a safety stock of 9 units for a cycle-service level of 90 percent. What is the equivalent P system?
EOQ D (52) = 4.2 or 4 weeks P = (52) = With d = 18 units per week, an alternative approach is to calculate P by dividing the EOQ by d to get 75/18 = 4.2 or 4 weeks. Either way, we would review the bird feeder inventory every 4 weeks. 75 936 Global Supply Chain Management SOLUTION We first define D and then P. Here, P is the time between reviews, expressed in weeks because the data are expressed as demand per week: D = (18 units/week)(52 weeks/year) = 936 units
T = Average demand during the protection interval + Safety stock = d(P + L) + safety stock Global Supply Chain Management Calculating P and T We now find the standard deviation of demand over the protection interval (P + L) = 6: Before calculating T, we also need a z value. For a 90 percent cycle-service level z = 1.28. The safety stock becomes 1.28(12.25) = 15.68 or 16 units Safety stock = zσP + L = We now solve for T: = (18 units/week)(6 weeks) + 16 units = 124 units
Global Supply Chain Management Ex: P System, Determine the Amount to Order d=30 units per day sd=3 units per day LT=2 days Service level 99% P=7 days OH=71 units
Global Supply Chain Management Q Model vs. P Model